IPinfo's data breadth and depth empower companies and initiatives of all sizes to implement various use cases from complex threat intelligence for Cybersecurity organizations to web personalization for Ecommerce companies. More than 40 billion requests are served every month for customers with various plans, from Free to Premium to Enterprise.
Over the years IPInfo relied on Google AppEngine to run and auto-scale our applications with minimal effort. AppEngine provides easy ways to configure and deploy new services, sparing teams from maintaining server infrastructure. It comes with batteries included: managed nginx Load Balancer (LB), managed SSL certificate provisioning and the ability to spin up multiple Docker containers based on fleet's average CPU load.
As our systems traffic increased over the years, so did the need for more control and observability on parts of the stack handled by AppEngine. In the past, there were periods of high variance in requests per second that caused our services to become flaky, but we could not have access to LB access logs to debug the requests that got held and didn't reach the application layer.
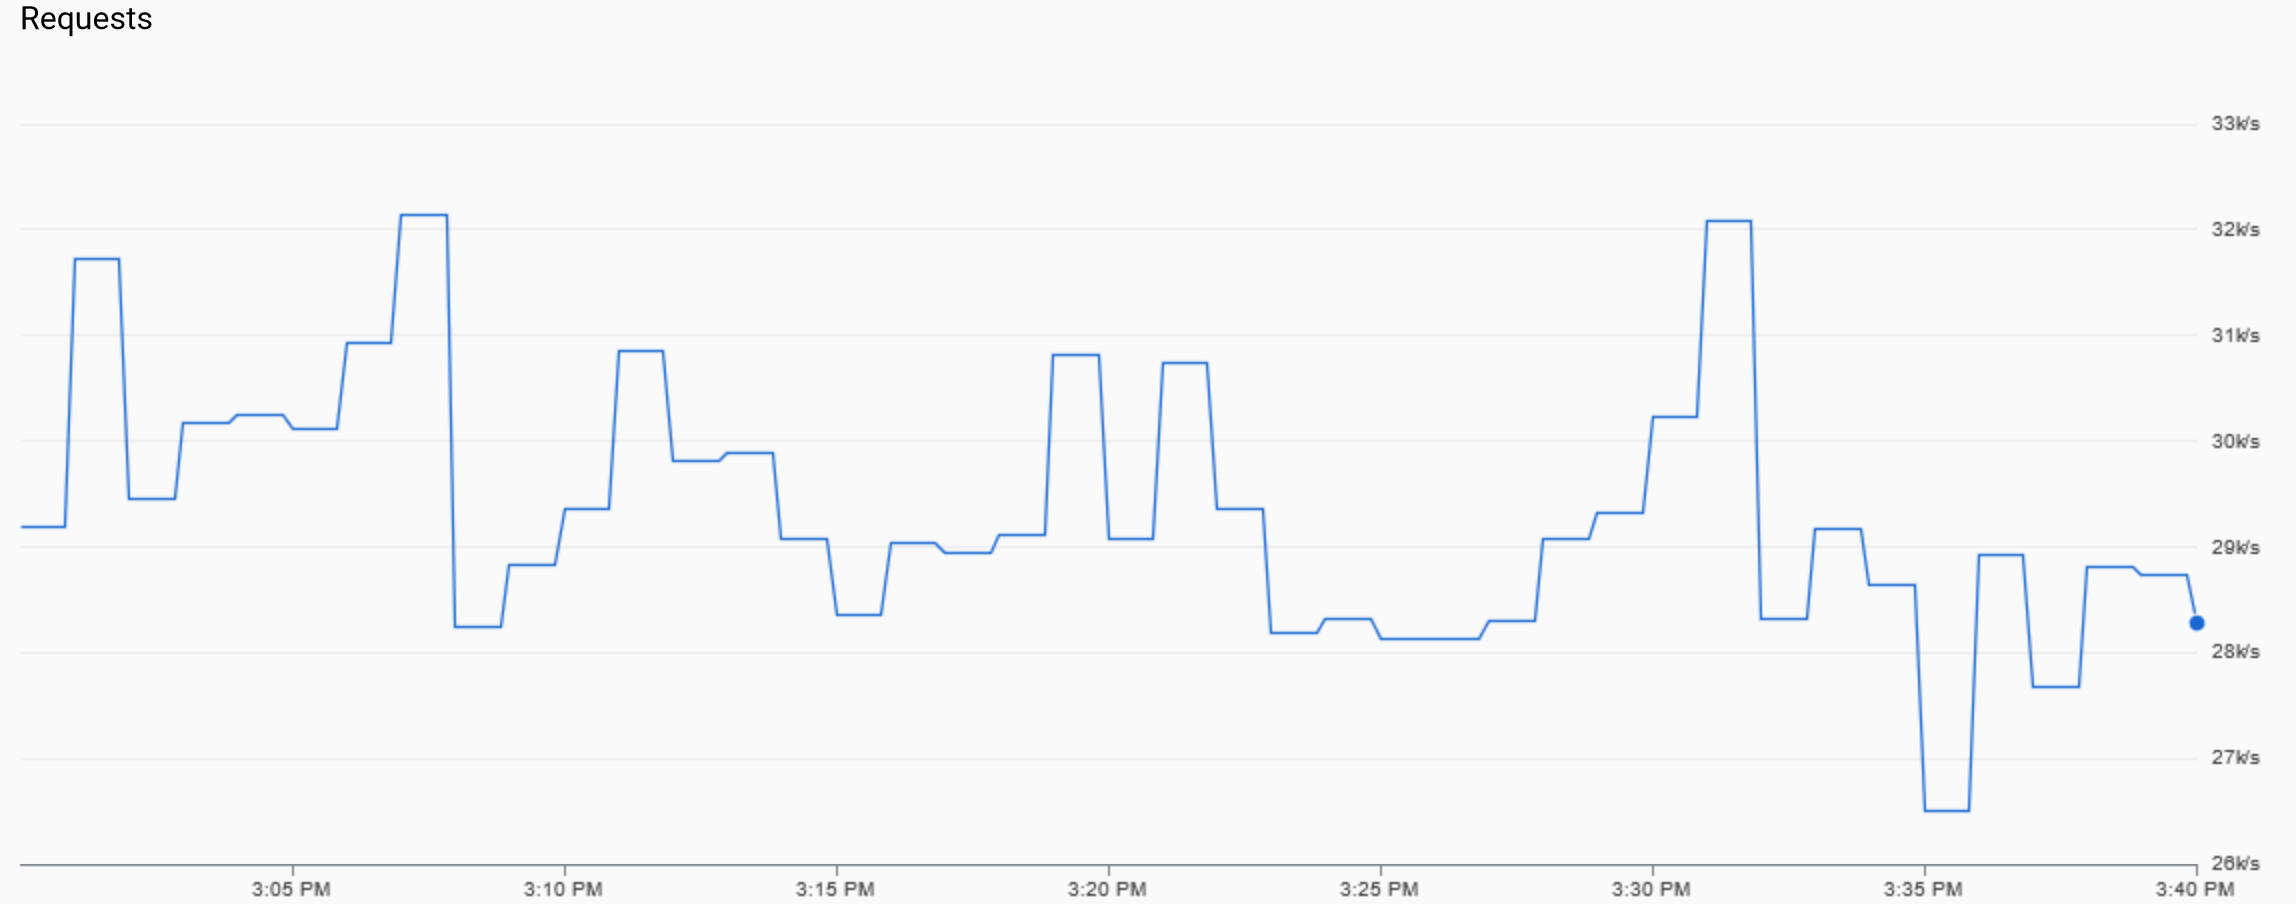
Legend: In a short span of 5 minutes traffic volume, measured as requests per second, can often swing 5% to 25%, as the graph above shows.
On one occasion there was a surge in LB's active TCP connections that sustained for several minutes and there was no way to tune nginx TCP connection reuse and timeouts settings as they are not exposed by AppEngine. On the other hand, AppEngine provided some LB ready-to-consume metrics off the shelf such as number of active connections, number of requests per second, a breakdown of response status code, latency percentiles, etc.
The need for more control led us to start a journey of considering managing infrastructure, but there was a strong desire to avoid doing so in the traditional sense of keeping operative systems up to date and worrying about per-VM configuration, etc.
Along the way, we faced a few challenges that required careful preparation, planning and rollback options as needed:
- guarantee traffic was encrypted at all times when migrating from AppEngine Load Balancer to target solution Load Balancer;
- ensure the new system has sane defaults and scales timely to meet demand;
- have production releases deployed through automation to reduce human error and reduce cognitive load on progressive traffic shifting across versions;
- set up reliable metric collection and easy-to-consume dashboards to meet all the ones that come for free with App Engine.
For those facing similar challenges, here are the steps we took to gain better infrastructure control while migrating our system without any downtime.
Getting more control on Infrastructure
When we were considering better alternatives to Google AppEngine there were two big avenues to explore: going ahead with Compute Engine managed instance groups (GCE MIGs), or going ahead with Google Kubernetes Engine (GKE). We ended up deciding on the latter, GKE, due to the level of control on workload execution, autoscaling and options for how traffic gets routed.
Kubernetes is a popular open-source container orchestrator. Just like your operative system enables multiple applications to run in parallel while competing for shared resources such as CPU and memory, so does Kubernetes on a cluster level. It works by spreading a number of workloads across a number of virtualized computers (nodes), provisioning and managing the resources they need to run, to meet desired cluster size, and so on.
It features a number of functionalities that allow the definition of scheduling constraints. Here are some examples:
- spread all service instances across different GCP zone (or any other alterative failure domain) - just like you would tell someone not to put all the eggs in the same basket
- when performing a rolling restart, keep a minimum number of healthy service instances at all times
- run a service on VMs that have certain characteristics whenever possible
Internally, it relies on a set of software controllers that track cluster state and act accordingly towards a given desired state: e.g. if at any given time there's a need to run twice as many service instances to reach a target average CPU usage, it takes care of expanding cluster size, assigning new service instances to new cluster nodes. Similarly, it handles cluster shrinking when such an amount of resources are no longer needed, ultimately cutting down costs in the long run.
Using Kubernetes also created the opportunity to choose from a wider set of load balancer options for ingress traffic: beyond nginx, we experimented with Istio, a service mesh technology that relies on a feature-rich, high-performance HTTP proxy called Envoy. Istio provided mechanisms to define weight-based multi-target routing rules, header/host/query parameter-based conditional routing logic, the ability to embed custom logic in the form of Lua scripts, request rewrite, and conditional request retries.
Target Architecture
After a period of experimentation to get acquainted with Kubernetes and Istio, a target architecture was finally designed and an incremental proof-of-concept was put together. During the proof of concept phase, occasional load testing was performed as continuous validation that we were moving in a direction that both allowed swift scalability and sustainable p99 latency metrics.
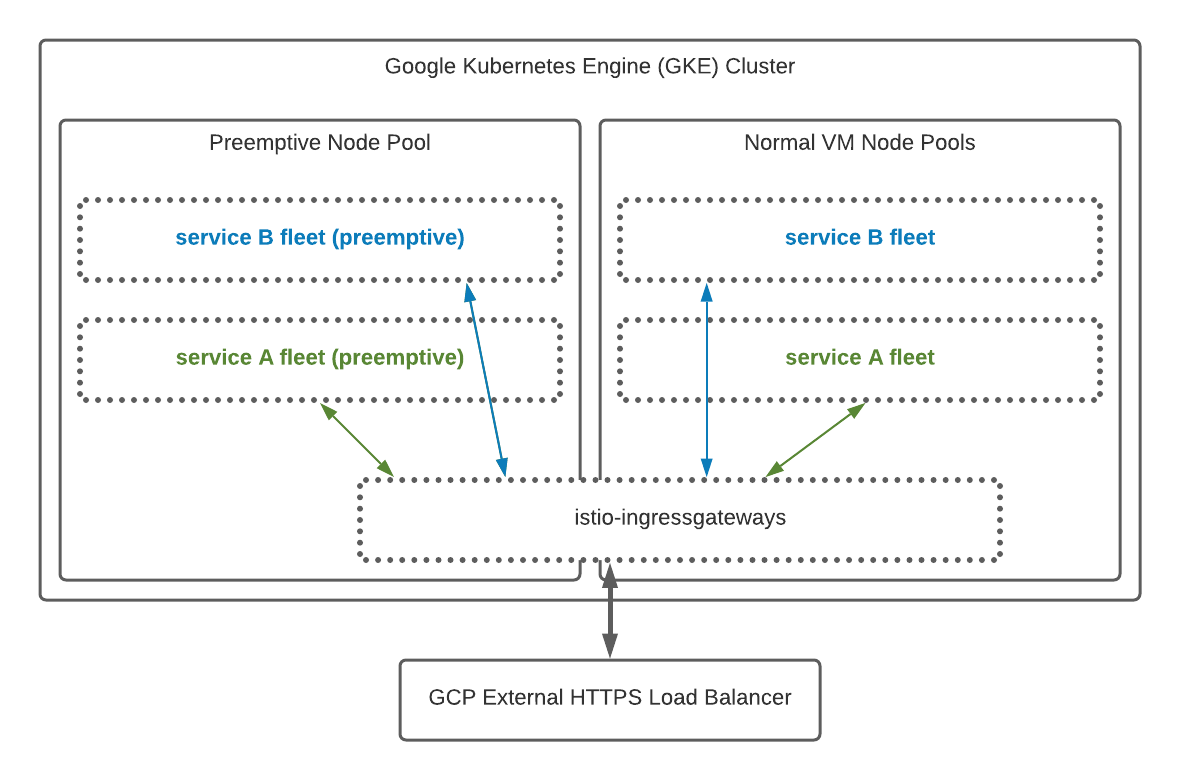
The final design consisted on:
- GCP HTTPS Load Balancer, sending traffic to Istio processes;
- For each AppEngine defined service, a Istio Virtual Service was defined. They ensure all requests matching a hostname and a set of endpoints are routed to the service instances.
- Service fleets, composed of multiple containers each, are deployed as part of multiple Kubernetes deployments: one dedicated to free tier traffic running exclusively on preemptive nodes. Others running on normal VMs. Each deployment is associated with an Horizontal Pod Autoscaler (HPA) that sets a minimum number of instances that need to run for a given deployment and a set of metrics thresholds that drive scaling decisions;
- Istio virtual services route traffic with different weights targetting different deployment instances: part of traffic goes to instances running on preemptive nodes, other part goes to normal instances. This enables traffic segregation and shielding paid customers from any erratic behavior made by bots or armies of free accounts, which tend to have a less predictable traffic pattern. At the same time, allows free traffic to run on VMs that cost less and allows deployments - preemptive and paid tier ones to scale differently according to each traffic/load characteristics;
- As a result of running a far higher number of service instances, out-of-process database connection pooling was implemented by adopting PgBouncer.
To finally achieve feature parity with all things IPInfo relied upon in AppEngine, we had to set up observability - both metric collection and visualization. For this we leveraged Prometheus and istio built-in metrics, published to GCP Monitoring (formerly known as StackDriver).
Migration transition stages
At IPInfo we run a 24/7 operation so from day one we knew the challenge ahead was to migrate to the target system with no downtime. To do that, migration had to be phased, progressing slowly and steadily through multiple stepping stones, and always with available options for rollback. There has been a significant effort that went into careful planning and rehearsal of all steps. Some of the easier aspects to migrate were these:
- Cron Jobs - these are used to implement a number of processes that run on schedule, such as customer lifecycle emails. In AppEngine they were implemented by calling an internal service endpoint. Migrating to Kubernetes was as easy as defining Jobs that invoked
curl. - Docker-based services - we were already using App Engine custom runtime, which basically allows the service to be provided as a docker image. Transitioning to Kubernetes meant there was no changes required as part of our packaging processes.
- Kubernetes health check probes - liveliness and readiness - gracefully align with AppEngine Liveliness / Readiness checks, so all we had to do was to set. On Kubernetes a startup probe was added for the services that take longer to start.
Some of the more challenging aspects were ensuring smooth traffic transition without momentary invalid SSL certificates, automating deployments with progressive traffic splitting between old and new versions, ensuring all appropriate metrics were being captured at multiple points of the stack, and finally getting Horizontal Pod Autoscaler thresholds right for the different service fleets.
Here's how we addressed these migration challenges without disrupting service for our users.
1. SSL Certificates
App Engine nginx load balancer provides an off-the-shelf SSL certificate managed by Google. GCP HTTPS Load Balancer also provides a similar certificate, but from rehearsals it may take 20 minutes to 1 hour to be issued and available in HTTPS LB.
Having unencrypted traffic was not an option since that would leave IPInfo API authentication tokens open for grabs for anyone eavesdropping on the network and could constitute a data leak to all clients that during that time would access their account's profile.
In order to overcome this, self-managed certificates were purchased and installed in GCP HTTPS LB, which supports multiple certificates at a time. Once a given SSL certificate for one of the multiple DNS was installed and DNS A record was pointing at HTTPS LB, we would then start the process of associating a new Google-managed SSL certificate. This process requires DNS to be set up and may take some time. There were times where it took too long and the most timely option was to recreate Google-managed certificate and associate it again with the same HTTPS LB.
During the process there was never a lack of encryption on the wire due to HTTPS LB support for multiple SSL certificates.
2. AutoScaling Parameter Tuning
The autoscaling thresholds are set on each deployment's HPA. There are multiple sets of values that were tuned during load testing exercises, and subsequently reviewed in production after migration.
Some of the aspects that we had to consider were:
- whether a deployment exclusively using preemptive nodes;
- average and peak traffic, analyzing traffic patterns over a week considering traffic routing rules and what different Kubernetes deployments would get a specific portion of traffic (free-tier vs paid users traffic);
- services startup time - as this directly affects how quickly a system can scale up.
Deployments exclusively deployed on preemptive nodes are subject to occasional dives in the number of healthy instances. This happens because preemptive nodes can be reclaimed by GCP at any time, and surely once every 24 hours - this acted as a natural chaos monkey, so autoscaling parameters had to take this into consideration. Generally speaking, we run preemptive workloads with a higher number of minimum instances. The idea is to have some cushion in case VM preemption occurs simultaneously with a traffic spike.
As preemptive nodes get a big portion of our free-tier requests, the autoscaling metric threshold in HPAs is way lower than the same for the same type of service in a normal VM deployment. This is purposely set to make the system more sensitive to traffic spikes.
An important factor when determining the number of minimum instances was to understand how quickly the system could scale up. For that, we took into consideration Docker image size and bootstrap time of each instance, by measuring it during load testing exercises. Shrinking docker image helped the system reach a desired number of instances much quicker and that is still a goal in the system's continuous improvements plan.
3. Deployment automation
When a new version is released to production, deployment scripts calculate the percentage of traffic that goes into preemptive nodes based on whether requests are made by free or paid users. It also calculates how much of it goes into a new version of the service versus the current version.
As an example, with a 20-80% free-tier traffic split between normal VMs and preemptive VMs, and with 5% of traffic going to a new version of the service, we would have the following breakdown:
| Normal VM | Preemptive VM | |
|---|---|---|
| Current version | 19% | 76% |
| New version | 1% | 4% |
Each specific traffic split is then set as different Istio virtual service weights.
Deployments occur every day, sometimes more than once a day. The procedure applies new Kubernetes Deployments and associated Horizontal Pod Autoscalers. It then performs a loop that slowly increases the traffic hitting the new version until 100% of traffic is migrated - for that, it applies similar logic as above to ensure the adequate normal vs preemptive VM traffic split (for the traffic that uses both) is achieved.
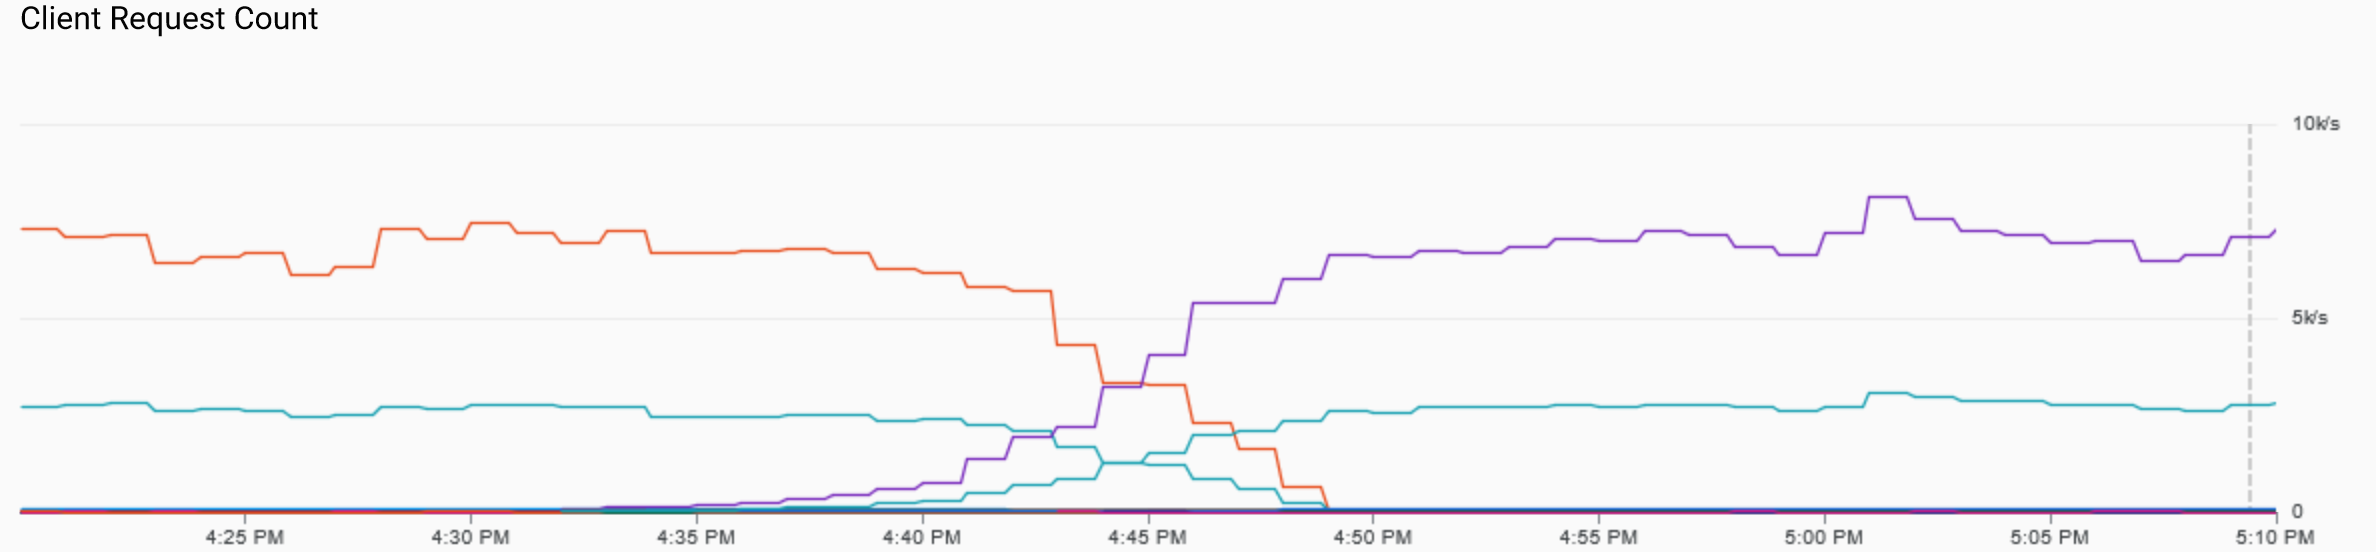
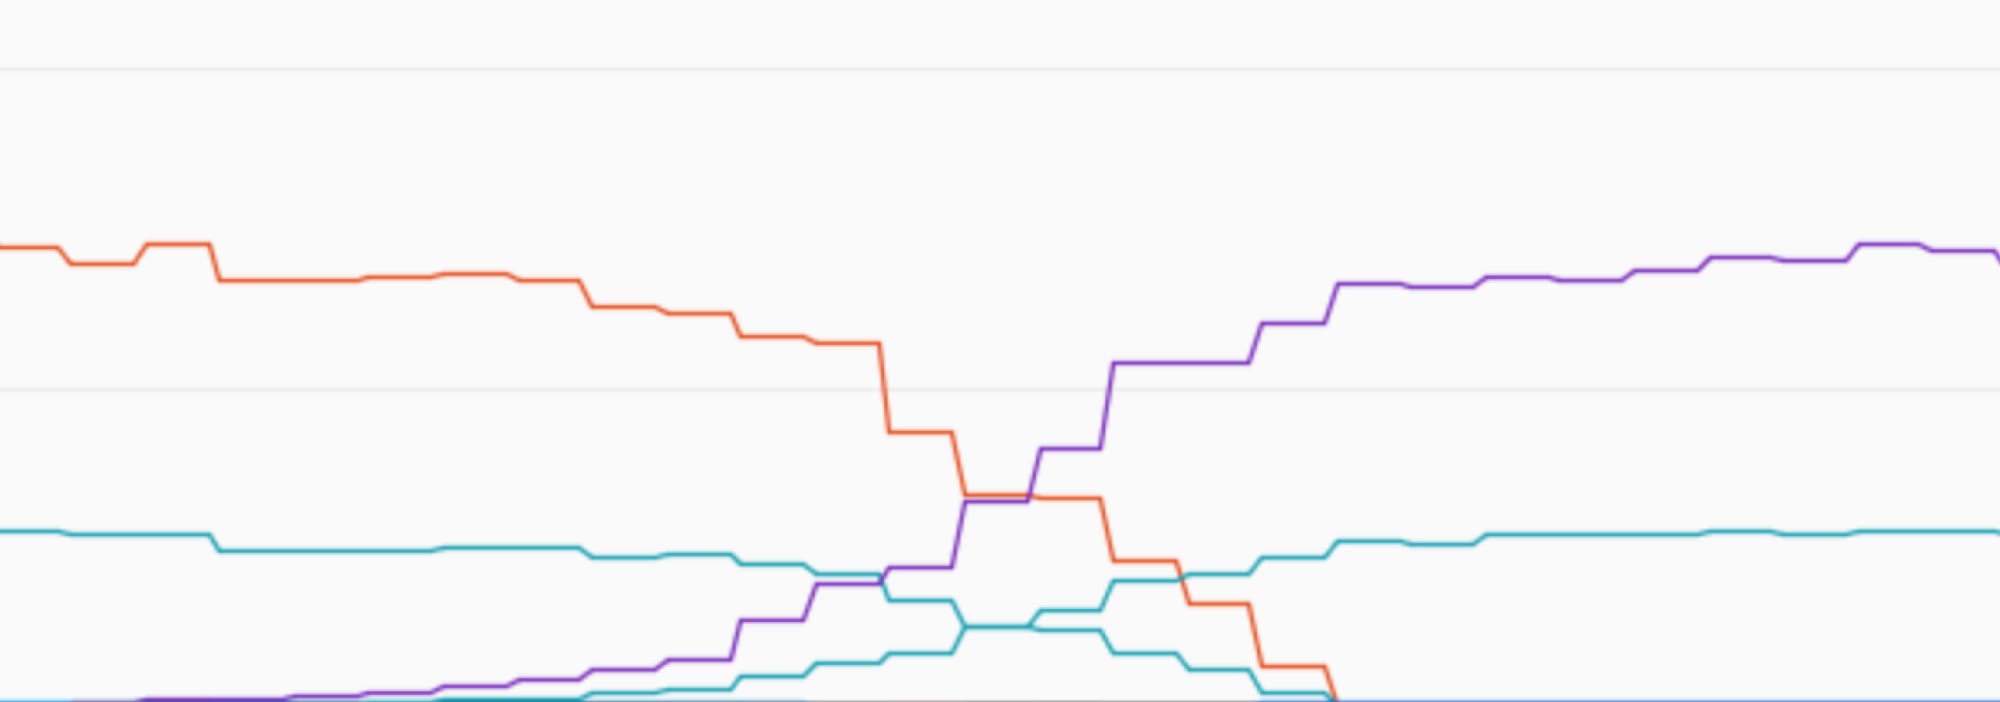
Legend: Graph showing requests per second for one of the internal deployments, grouped by response code and service version, during a period of smooth traffic transition from old to new version.
This smooth transition from one version to the other helps us monitor p99 latency and HTTP errors on the new version, similar to a canary deployment. At any time we can interrupt the deployment process if something feels wrong, and have such feeling backed by hard data. To help detect eventual problems and monitor API uptime and stats, a number of external solutions are used to constantly hit IPInfo platforms and build synthetic service quality metrics over time.
4. Observability
GKE didn't come with as many built-in metric collection configured. To observability parity with App Engine, we had to investigate and experiment with some solutions. We opted for Prometheus, a popular time-series database and metrics format.
From a collection perspective, we ensured that all relevant components exposed metrics in Prometheus format as HTTP endpoints accessible internally in Kubernetes network. Some components supported it natively (like Istio), others (like PgBouncer) had to run with sidecar that queried the right PgBouncer internal state and exposed it in Prometheus-formatted endpoint.
Prometheus (time-series database) was configured to grab the metrics from these HTTP endpoints periodically. Capturing the right metrics at the right frequency in order to keep Prometheus memory usage at sane levels proved to be a challenge, we resorted to a combination of recording rules and shorter metrics data retention periods.
To overcome the shorter retention, all metrics in Prometheus are shipped to Google Monitoring (formerly known as StackDriver). This is achieved by using Google's stackdriver-prometheus-sidecar which runs as sidecar container in Prometheus deployment.
Empirically it may take up to 2 minutes for a given metric to show up in Google Monitoring. As such. Google Monitoring is used to provide a historical overview through custom dashboards, where we also combine metrics coming from GCP HTTPS LB. For more immediate needs on knowing what's going on, we use Prometheus as it timely displays all collected metrics a few seconds after collection.
Google Monitoring dashboards were split into multiple dashboards as having loads of metrics on a single one often impacts load time and usability. The split followed a top-down approach: one dashboard shows global service metrics, other dashboards drill down into per-service metrics. This separation resulted in faster dashboards and made it easy to reason about where to look for further metrics when performing investigations.
Migration Day
The M-Day arrived and we had our checklist ready. For any step to be taken, there was a fallback procedure.
As preparation steps:
- Kubernetes deployments were set with a minimum number of instances 1.5x higher than normal. Inflating this minimum was to safeguard against any wrong estimation taken from load testing exercises;
- self-managed SSL certificates were installed on GCP HTTPS Load Balancer, and tested with
curl; - DNS A record time-to-live (TTL) was set to 30 seconds - while this meant a lot of more load on Cloud DNS service, it served as the main switch between AppEngine and GKE. If anything went wrong, switching back would mean clients would take 30 or more seconds to AppEngine's LB IP address.
When all things were in place, DNS A records were changed to point to the new GCP HTTPS Load Balancer. The saw traffic migrate over a period of almost 24 hours. Throughout the procedure, all real-time collected telemetry was carefully monitored. The team was constantly looking for any signals that could hint a rollback was required.
It all went according to plan:
- a couple of hours after migration, traffic was already being served with Google-managed SSL certificates;
- artificially inflated minimum number of instances across all service fleets were providing a comfortable service capacity margin against spikes;
- free-tier traffic routing splits were fairly set so normal VMs provided a decent p99 latency for paid customers and free traffic spikes were felt mostly by instances running on preemptive nodes.
End result and next Steps
This was a prolific and rewarding journey for the team. GKE provided the control we so much needed on App Engine without forcing us to manage VMs and its configuration. Today IPInfo backend systems run more predictably against traffic spikes and provide suitable visibility into what's happening, through logs and metrics.
Now our team's current focus is making the system faster by optimizing service instances startup times and better static asset serving.
GKE helps us continuing to manage infrastructure through infrastructure as code, deal with service instances like cattle rather than pets and simplifies cross region deployments through standardization, and, together with GCP Cloud DNS, opens the door to perform geo load balancing across clusters spread across the world.
Our special thanks go to Alex Rodrigues for amazing work on the IPinfo infrastructure along with our web team.
Interested in joining a small team that's doing big things? We're always looking for great people to join. Check out our most recent job openings!
About the author

Internet Data Expert