


Detect Residential Proxies with IPinfo Max
Get full visibility into residential proxies and anonymizing services, with recency and frequency signals for fraud and security teams.
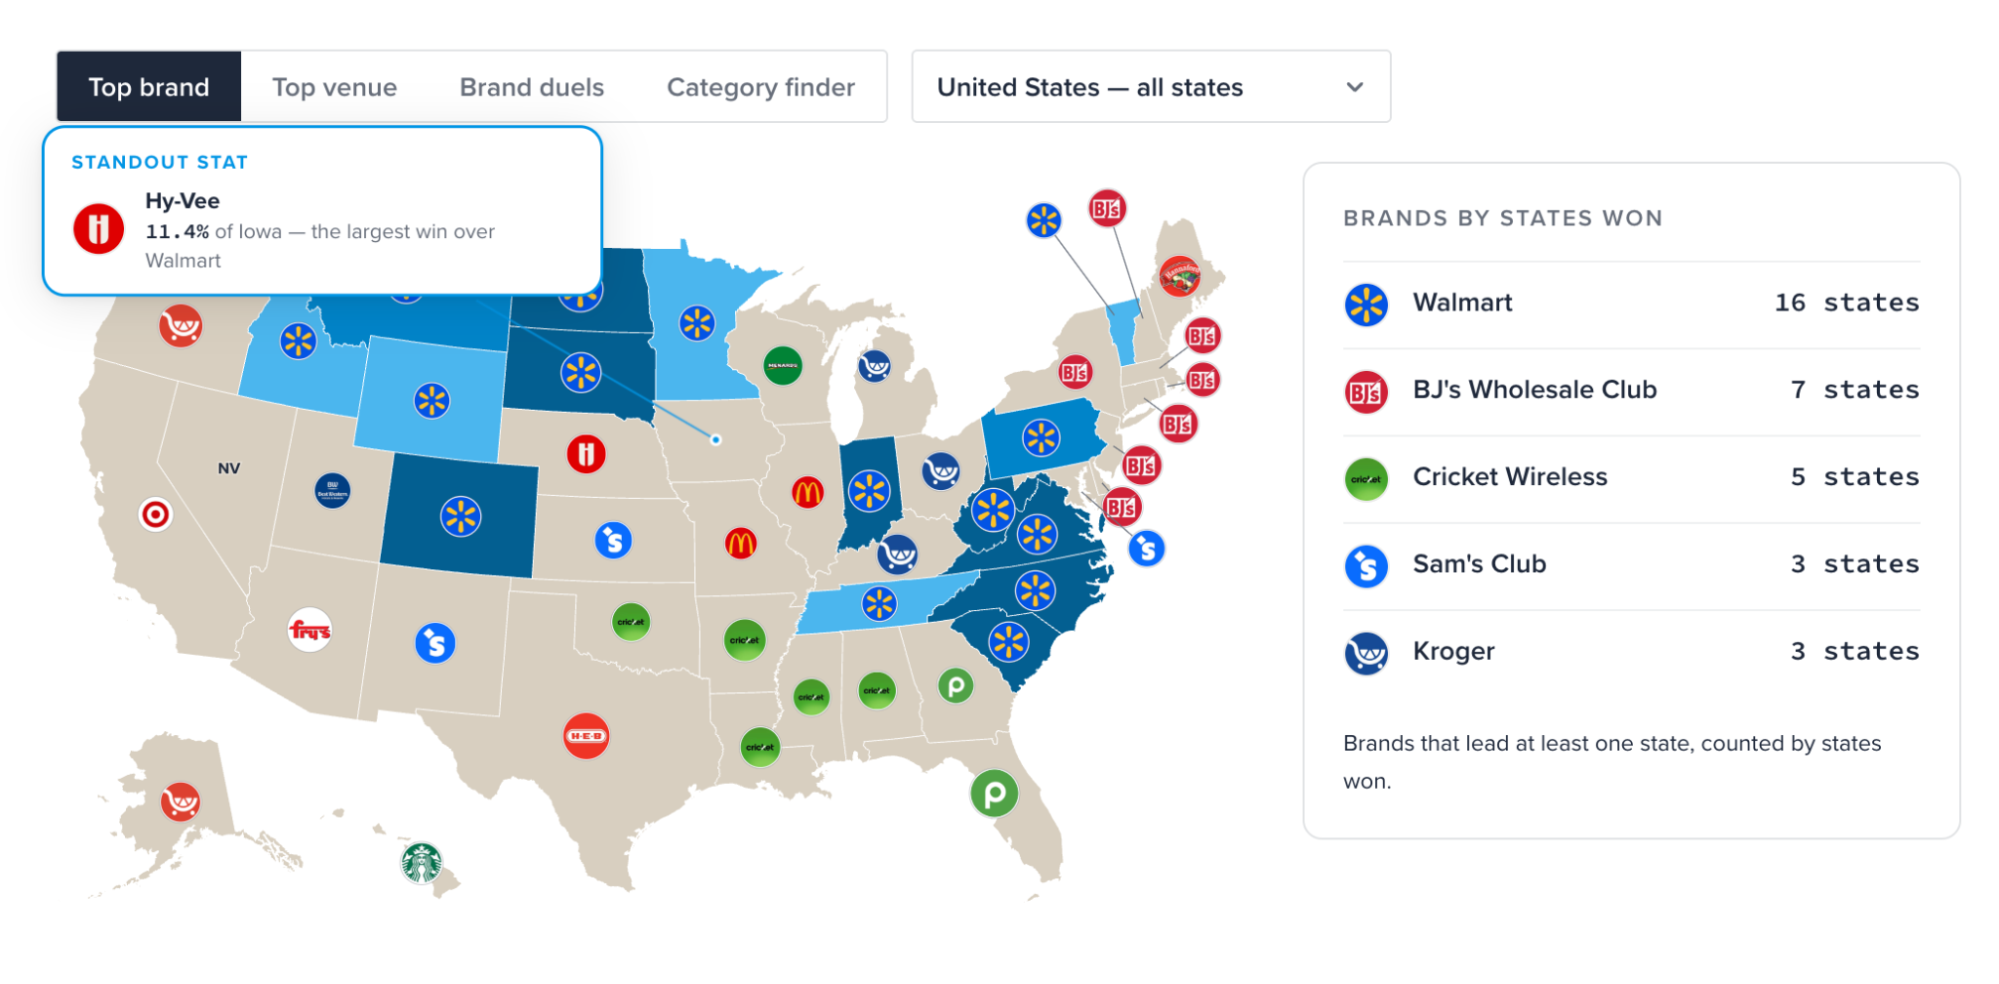
Get IPinfo MaxAsk which brand dominates America and Walmart is the obvious guess. In our public WiFi data, it carries the largest share of device connections in 16 US states. The other 34 go mostly to regional chains.
By type of place, the answer changes. Hotels lead 44 states. Grocery stores (Walmart's category) lead none, and in Nevada casinos come close to overtaking hotels.
Every question we asked of IPinfo Places drew a different map of the same country.
We mapped this data by matching anonymized observations of IP addresses on public WiFi networks to physical venues across the United States. Beyond providing the geolocation of an IP address, Places can identify the name and kind of venue behind it.
Some of these metrics are open to interactive exploration in our Most Popular Places Report: top brands, top venues, brand rivalries, and venue categories. It refreshes on the first of each month, so the figures there may have moved on from the snapshot in this post.
This is the first in a series of data posts built on Places. Later ones widen out to how venues behave across hours, days ,and seasons, and to how the picture changes elsewhere. We start in the US, where the differences between states are often sharper.
What Places actually Is
Most IP geolocation answers the question "which city?" Places answers "which building?" When a device connects to a venue's public WiFi, an airport terminal, a hotel lobby, a supermarket, that network becomes the signal. We match the IP addresses observed on it to the venue behind them, with building-level precision.
That context is what the dataset is for. For risk and fraud scoring, five hundred logins from one IP is an airport lounge, not credential stuffing. For geolocation itself, some addresses have no real city (like a hotel chain reusing one across several states) and a shared venue IP is more useful than a confident wrong answer.
In the United States that comes to 124,313 matched venues on 157,724 venue IP addresses. Each venue carries a name, one of 54 standardized categories, real coordinates, and the WiFi network name. We have matched these places to their associated brands — more than 1,600 across the US, which is what makes the state-by-state comparisons in this post possible.
The dataset updates continuously and we are actively improving how venues are matched. The figures here come from a single snapshot of it, taken on September 14, 2026, a cumulative view rather than a single day's readings.
Some venue types are deliberately excluded. Hospitals, clinics, schools, childcare and places of worship are not in the dataset. Not every kind of place belongs in a geolocation product.
Places is part of the geolocation data in IPinfo Core and Max, returned in the response you already request, or delivered as a file if that is how you consume our data. The launch post covers the mechanics in full.
Walmart wins 16 states. Regional chains take the rest
Walmart leads Colorado, Idaho, Indiana, Minnesota, Montana, North Carolina, North Dakota, Pennsylvania, South Carolina, South Dakota, Tennessee, Virginia, Vermont, Washington, West Virginia and Wyoming.
More regional brands dominate elsewhere. H-E-B leads Texas. Publix takes Florida and Georgia. Hannaford takes Maine. Hy-Vee wins Iowa and Nebraska, and Iowa is where Walmart is beaten by the widest margin anywhere in the country: 11.4% of observed devices in Iowa, compared with Walmart's 4.1%.
Our map counts each store name separately, even when several belong to one company, which hides one larger network. Kroger leads Kentucky, Michigan and Ohio under its own name, Alaska and Oregon through Fred Meyer, and Arizona through Fry's Food and Drug. Count those banners together and Kroger would take six states, second only to Walmart.
Two other winners are not grocers at all. BJ's Wholesale Club, a warehouse club rather than a supermarket, leads seven states. Cricket Wireless leads Alabama, Arkansas, Louisiana, Mississippi, and Oklahoma, and that result appears to be driven more by reach than by crowds. The chain has many small stores broadcasting Cricket-Guest, each contributing a small number of devices. A brand can win a state by appearing in many places rather than by attracting large numbers at individual locations.
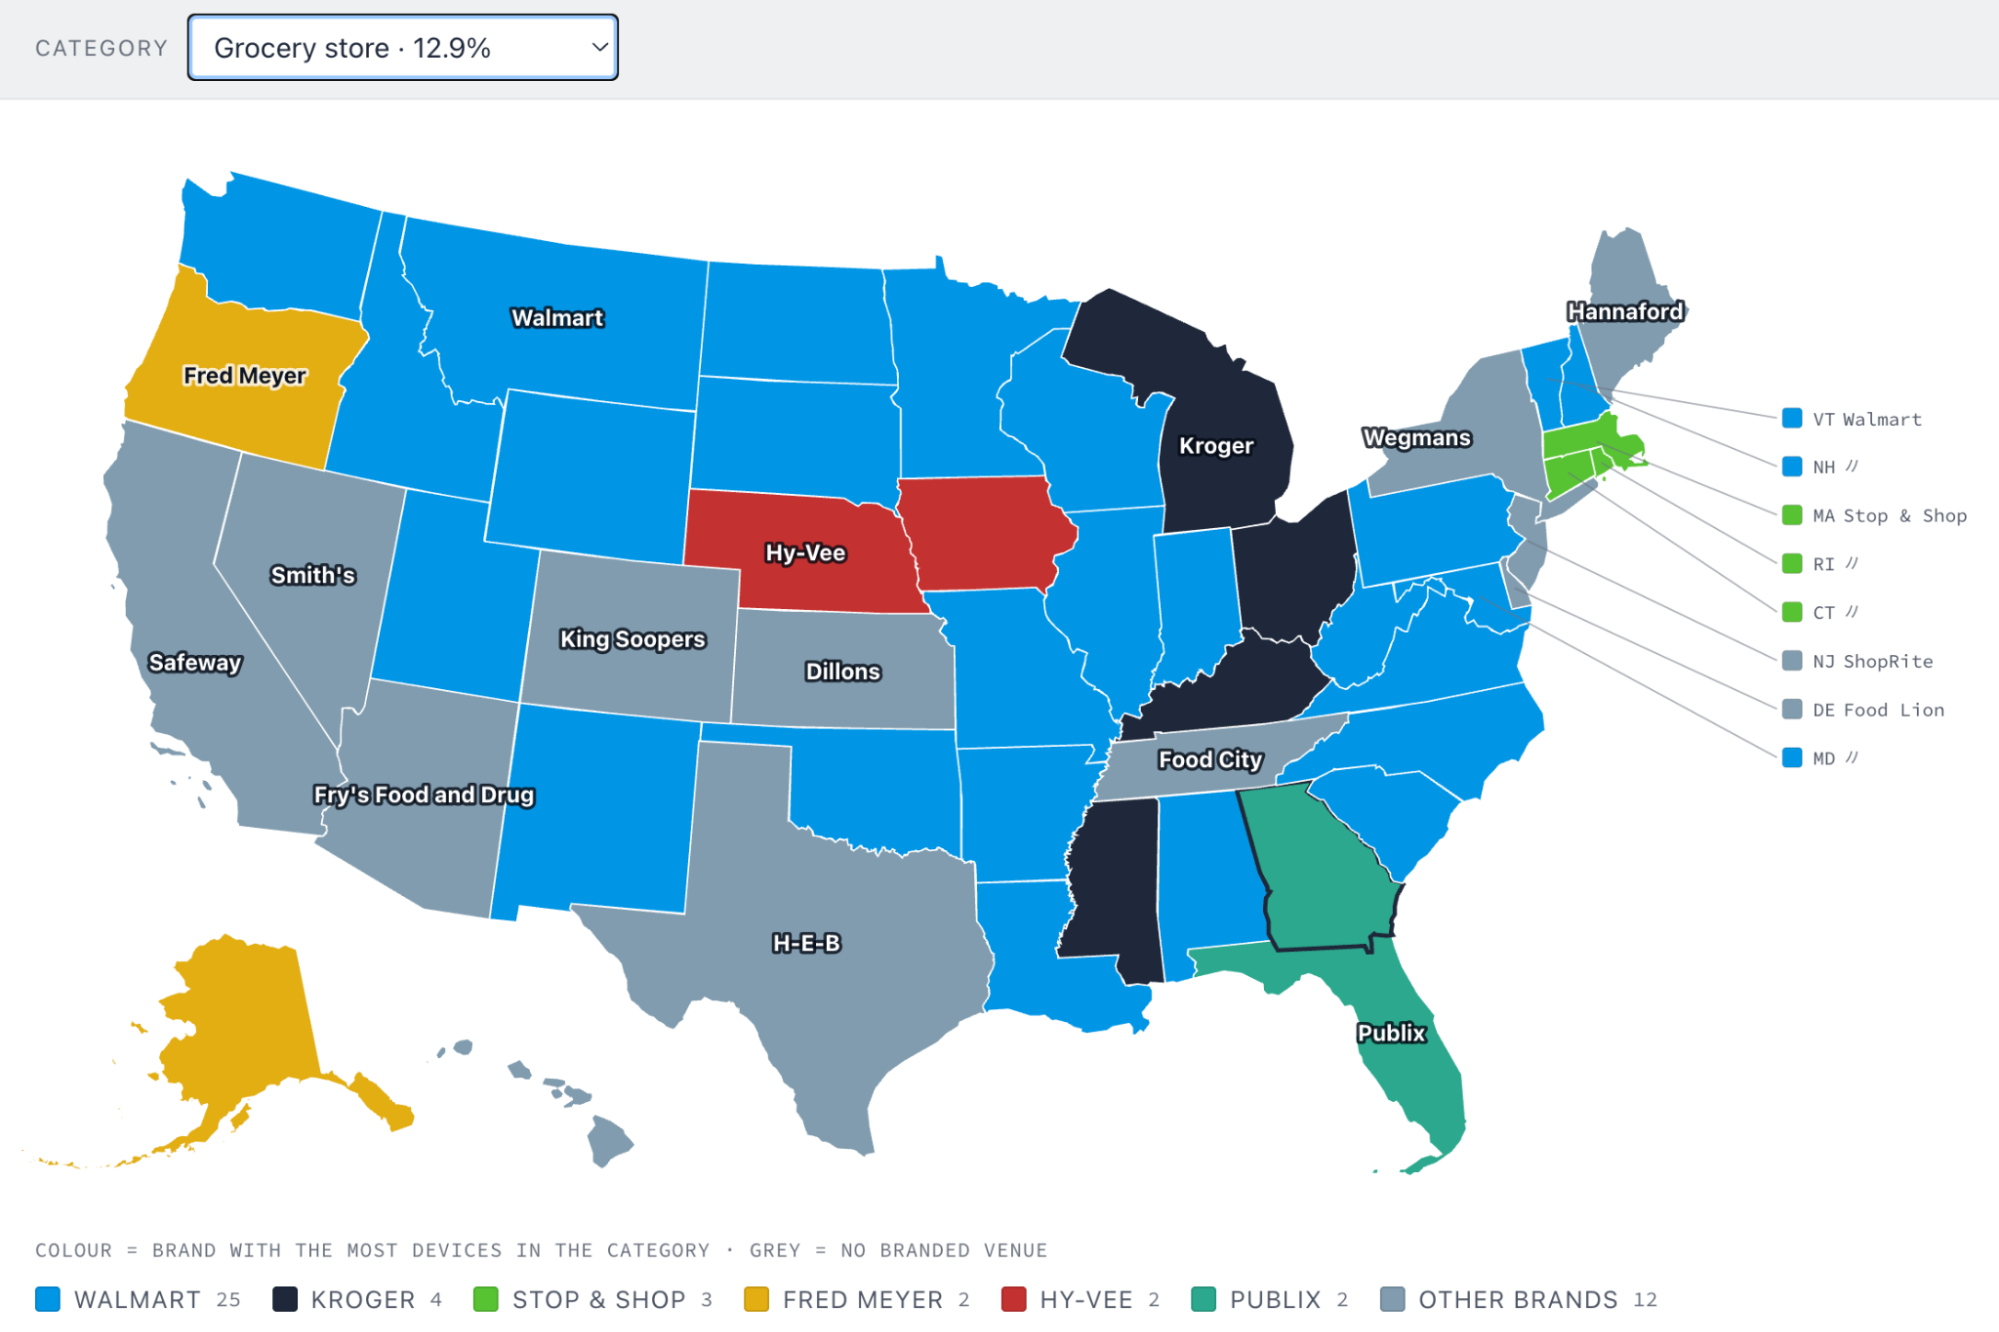
Narrow the question to supermarkets alone and the regional map gets sharper.
Walmart takes 25 states on groceries, exactly half the country, and sixteen different chains take the rest. The regional winners are not close contests: Publix carries 63.8% of the grocery devices we see in Florida, H-E-B 60.1% in Texas, Hy-Vee 67.3% in Iowa. Wegmans wins New York, King Soopers Colorado, ShopRite New Jersey, Food City Tennessee, Hannaford Maine, Stop & Shop across Connecticut, Massachusetts, and Rhode Island.
The banner effect is stronger here than anywhere else in this data. Fry's in Arizona, Smith's in Nevada, King Soopers in Colorado, Dillons in Kansas, and Fred Meyer in Alaska and Oregon are all Kroger. Counting groceries only, and counting those banners as one company, Kroger wins ten states.
The Dunkin' border
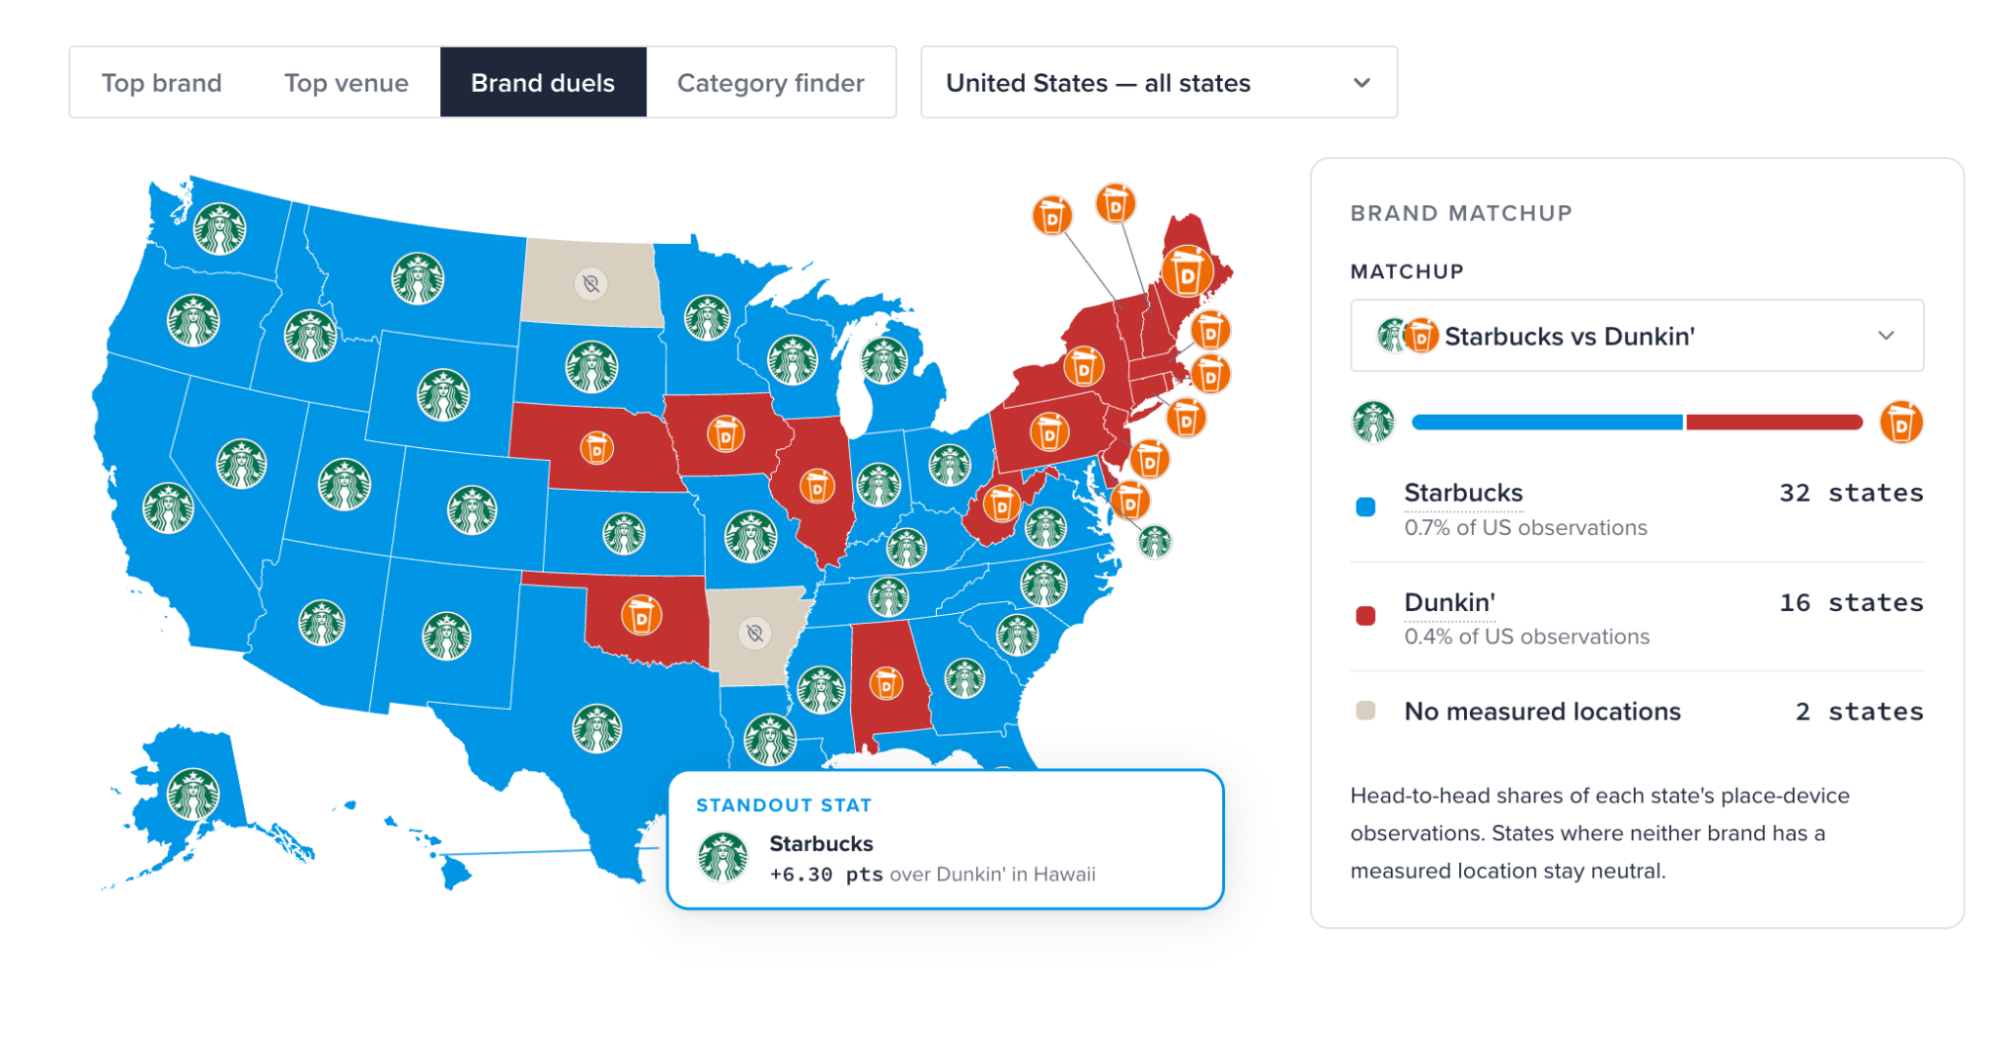
National brands may be recognizable across the country, but their WiFi footprints still reveal strong regional patterns. Comparing two competitors head to head makes those differences especially easy to see.
Starbucks leads 32 states and Dunkin' 16. One of Dunkin's sixteen is an exact tie, and in two states neither brand appears at all. Dunkin's strongest territory forms a nearly continuous block from Maine southward through the Northeast to Delaware, with a few states sprinkled in elsewhere.
Illinois sits almost exactly on the boundary. Both brands sit under 1% of the devices we observe in the state, and which one leads depends on the day.
Other rivalries are far less competitive. McDonald's beats Burger King in all 50 states, and Burger King does not appear at all in three. Marriott beats Hilton 33 states to 13 when we compare the flagship brands only, before counting either company's wider portfolio, with four states where neither appears.
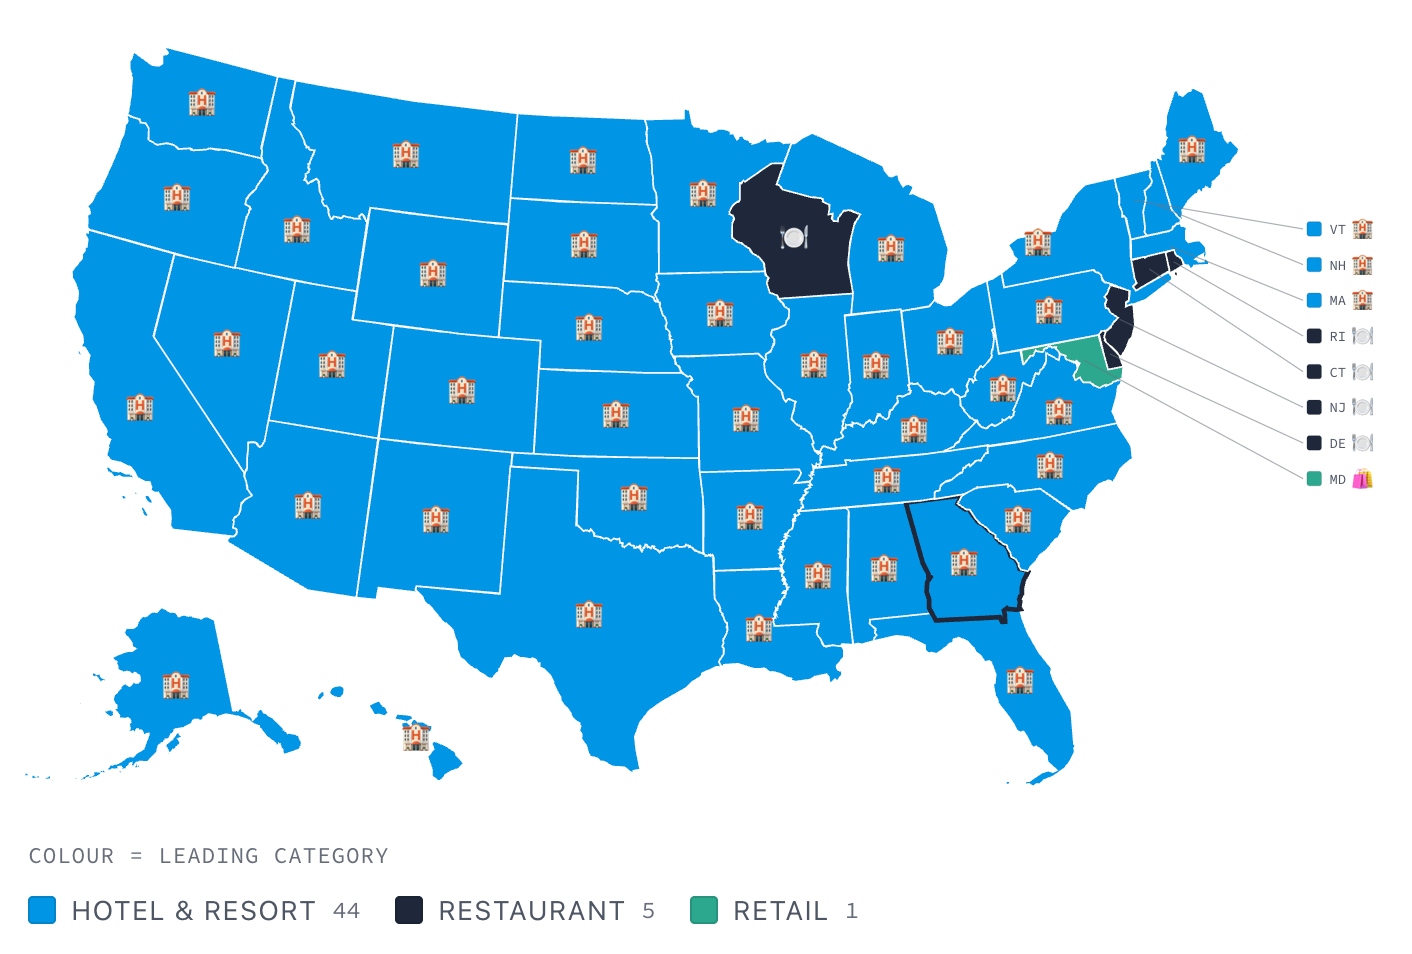
Hotels lead 44 states. Nevada looks like nowhere else
Step back from brands to venue categories and the national picture becomes much more uniform. Hotels account for 25.8% of the devices we observe across US venues and lead 44 of the 50 states. Hotels have led that count in every snapshot we have checked since July 23.
Hotels lead for two reasons pulling the same way. About one in five of the venues we match is a hotel, and people use the WiFi once they arrive — a hotel carries more devices than a restaurant, a gym, or a coffee shop, the places you pass through rather than stay in.
Airports are the other way round. There are only a few hundred of them in the data, but each carries about fourteen times as many devices as a hotel. They are the top individual venue in 29 states, and all ten of the busiest individual venues in the country are airports, led by Miami, which alone accounts for about 11% of all the devices we see at US airports.
Universities take four of those slots (Kansas State, Kentucky, Alabama at Birmingham and Ohio State) each the single busiest venue in its state, ahead of every airport, stadium ,and shopping centre there.
The six exceptions to the hotel pattern are worth a closer look. Retail leads Maryland. Restaurants lead Connecticut, Delaware, New Jersey, Rhode Island, and Wisconsin.
Nevada doubles down on its reputation. Casinos account for 37% of observed devices in the state against 2% nationally, roughly eighteen times the national share and the sharpest state-level departure from the US mix that we found. Hotels account for almost exactly as much again, which in Las Vegas is often the same building.
Some brands draw their own regional maps
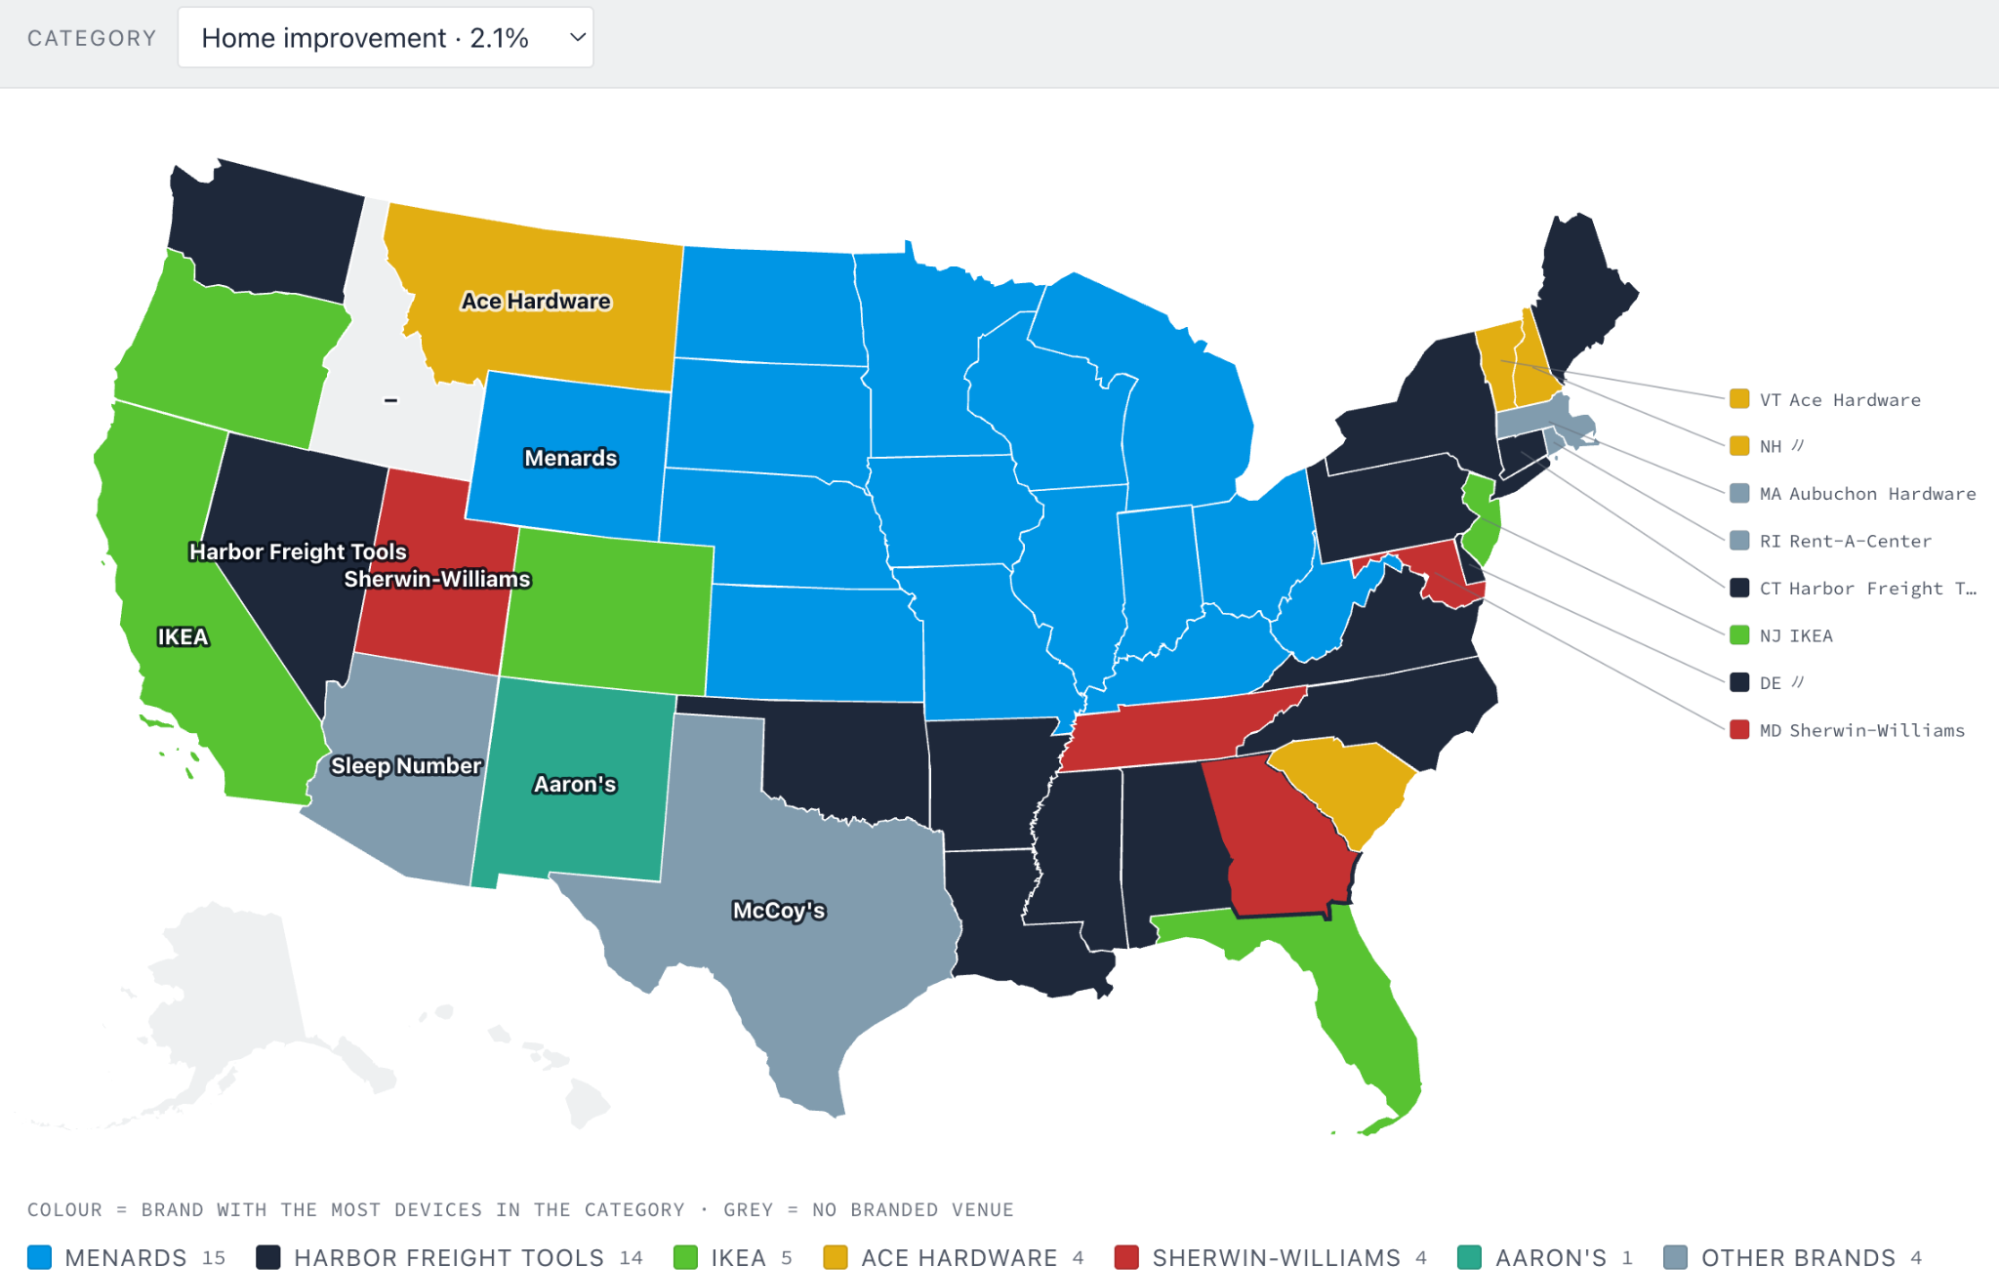
Looking within individual venue categories produces another set of borders, and some categories have an overwhelming national leader. CVS is the top pharmacy brand in 44 states. Planet Fitness leads gyms in 41. Starbucks leads coffee shops in 41. Hampton is the top hotel brand in 18, though regional geography shows up in the exceptions: Best Western leads six states across the Mountain West, the Plains and the Northwest. Toyota is the most common top car dealership brand.
Home improvement produces one of the clearest regional splits. Menards leads 15 states across the Midwest, while Harbor Freight leads a scattering across the South and the coasts, in much smaller numbers.
Only three states don't pick McDonald's
Inside the restaurant category, McDonald's carries the most devices in 46 states. Dunkin' takes New Hampshire and Rhode Island, Chick-fil-A takes South Carolina, and Georgia is an exact tie between Chick-fil-A and McDonald's. Several more are close enough to change between exports, with a handful of devices separating the leaders in Connecticut and West Virginia.
Second place is where the country shows up. Jack's is the runner-up in Alabama, Casey's across Iowa, Missouri, and Nebraska, Culver's in Wisconsin, Cafe Rio in Utah, Village Inn in Vermont, Cracker Barrel in Mississippi and Tennessee.
Some categories barely exist, and New York owns most of them
The 54 venue categories are wildly uneven. Hotels account for 25.8% of the devices we observe, restaurants 17.7%, retail 14.4% and grocery stores 12.9% — four categories carrying more than two thirds of everything. Aquariums account for 0.03%. The report ranks all 54, each with its share and its most common brand.
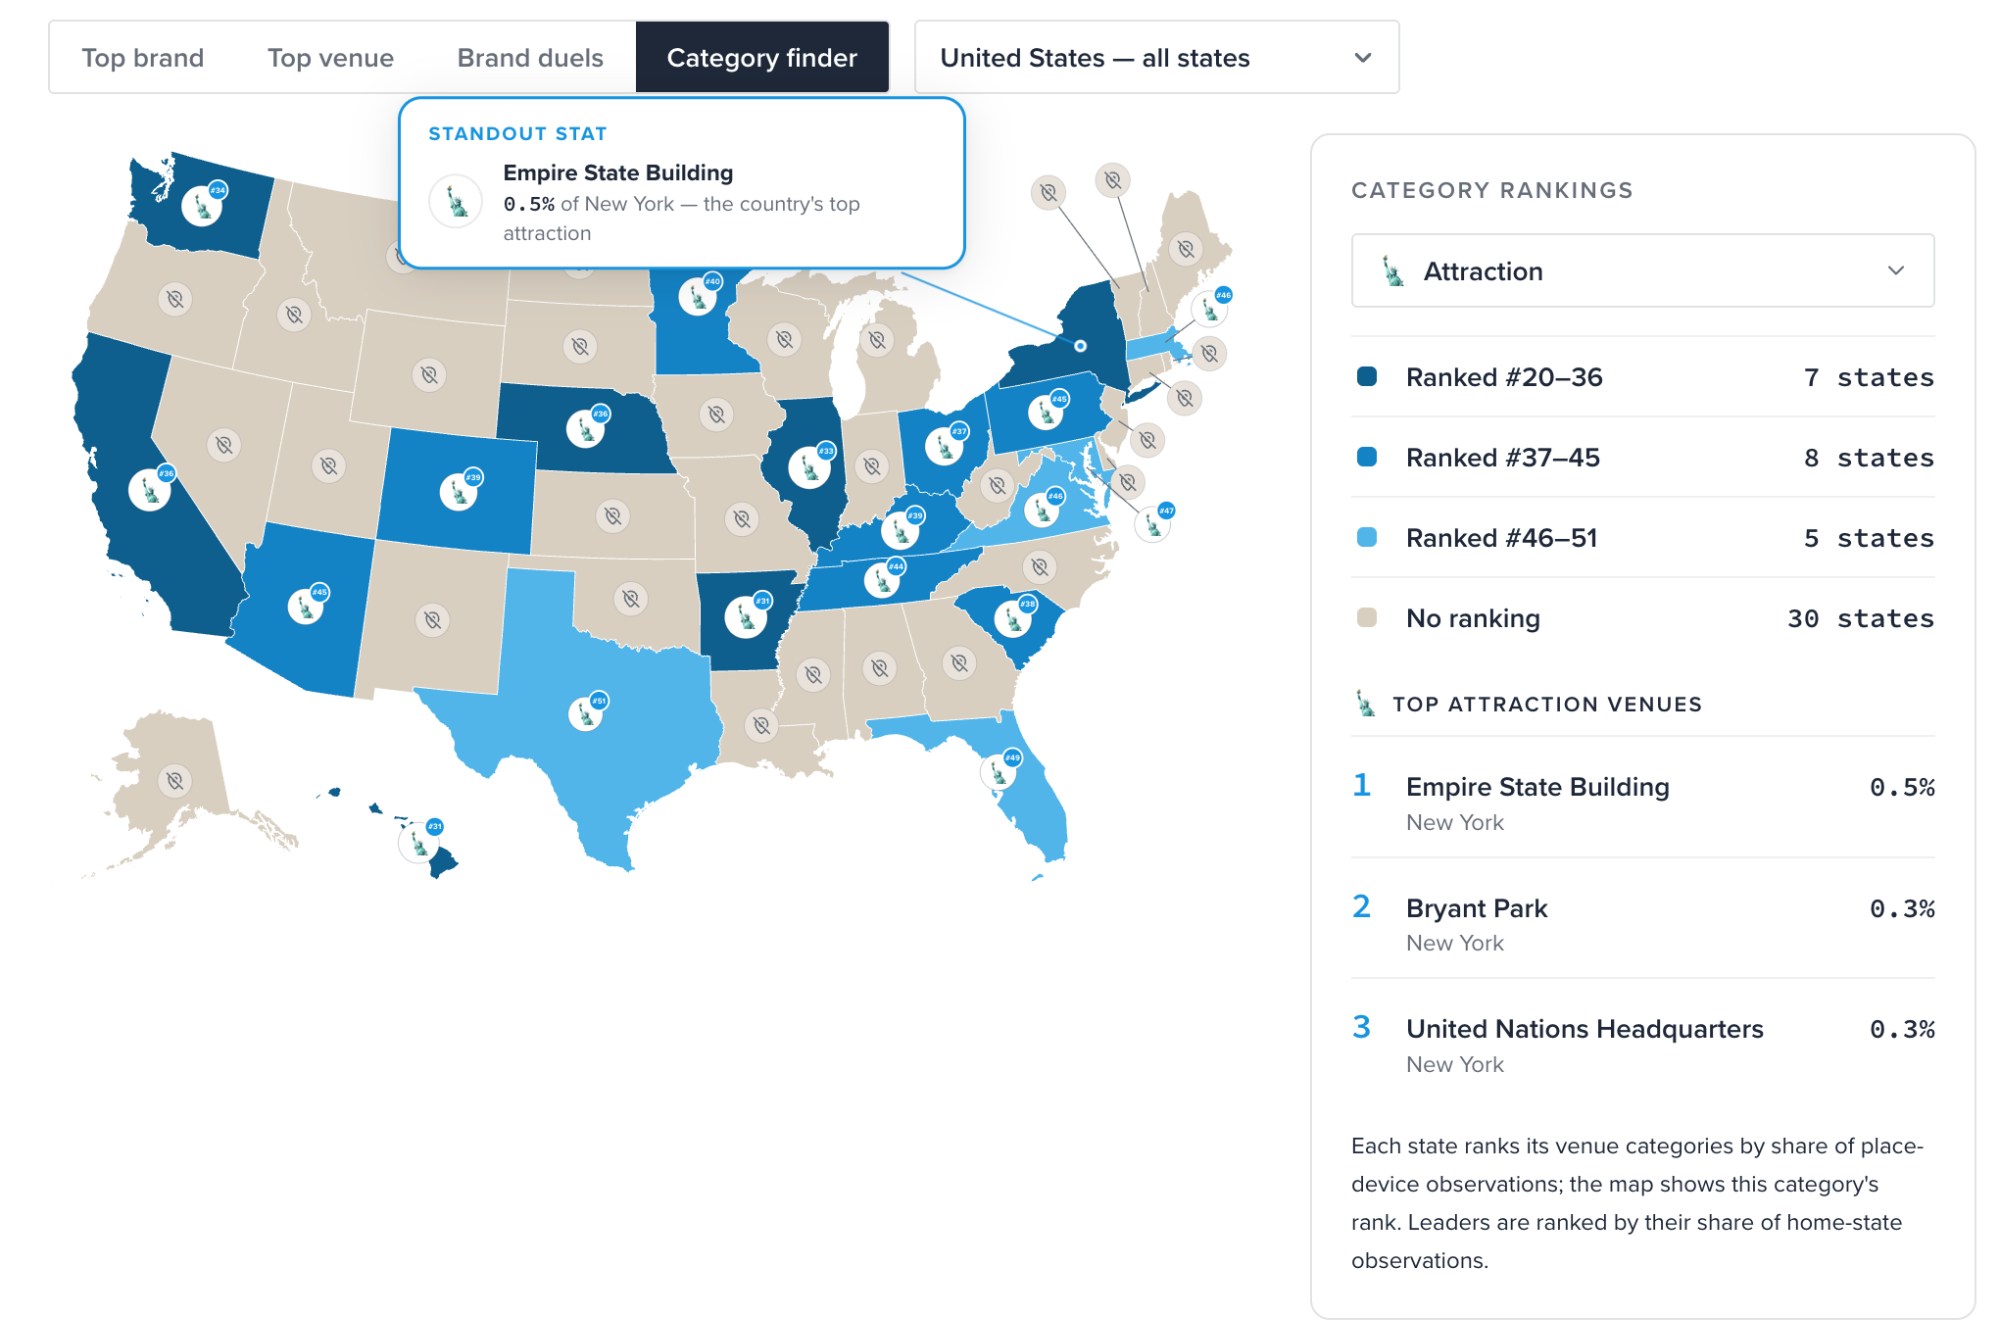
Select “attractions” in the report and 30 of the 50 states turn gray, because nothing we would classify as an attraction registers in them at all. Those states are not short of landmarks. Landmark WiFi is simply rare, and the whole category amounts to about 0.2% of the devices we observe nationally.
Where a category does concentrate, a single metro area tends to own it. In our September 14, 2026, snapshot, New York holds the top three attractions in the country:
- Empire State Building
- Bryant Park
- United Nations Headquarters
New York also holds the top three museums, led by the American Museum of Natural History. Florida holds the top three theme parks, with Universal Orlando ahead of Magic Kingdom and EPCOT (a ranking by guest WiFi, not by attendance). The busiest ski resort by devices is Camelback Mountain in Pennsylvania, ahead of Park City in Utah and Big Sky in Montana, which says more about day visitors and guest WiFi than it does about snow.
Who provides the connection
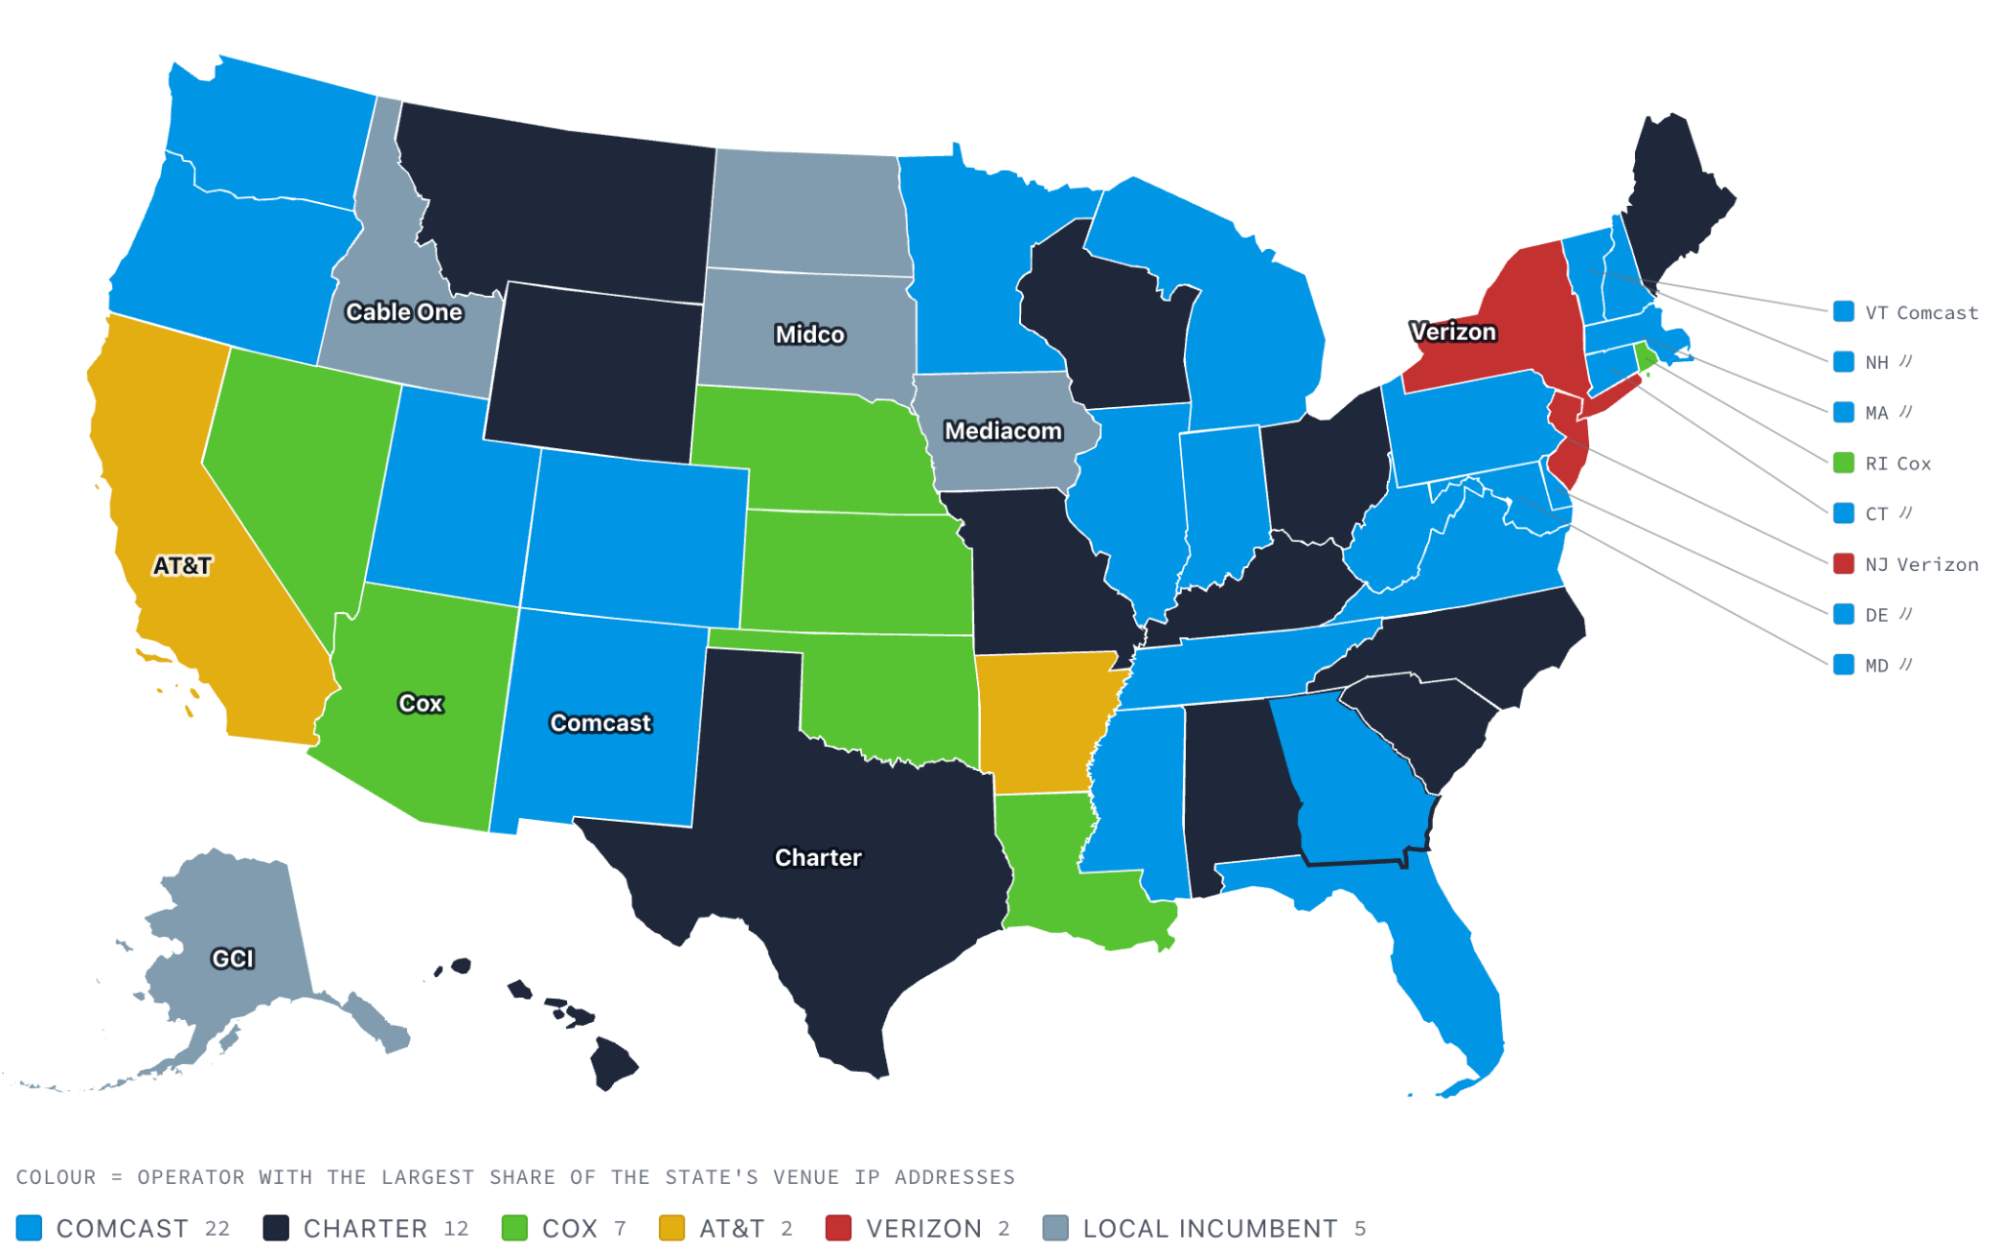
Every hotel, supermarket, restaurant, and airport WiFi connection operates through an Internet provider, and the networks behind the venue IP addresses produce another map of the United States. Five national operators lead 45 of the 50 states between them:
- Comcast: 22 states, 21.3% of all venue IP addresses (AS7922)
- Charter: 12 states, 19.1%, across several networks including AS20115 and AS10796
- Cox: 7 states, 3.9% (AS22773)
- AT&T: 2 states, 9.1% (AS7018)
- Verizon: 2 states, 8.9% (AS701)
Leading a state and being large are not the same thing. Cox leads three times as many states as AT&T while carrying less than half as many venue IP addresses, because it is absent from most of the country and dominant where it operates. Those five account for just under two thirds of all venue IPs; the rest is spread across more than 3,000 other networks.
The other five states belong to regional providers: GCI in Alaska (AS8047), Mediacom in Iowa (AS30036), Cable One in Idaho (AS11492), and Midco in North Dakota and South Dakota (AS11232). In both Dakotas, Midco carries more than 40% of the venue IP addresses we observe.
Look at your own state
The report is at ipinfo.io/reports/most-popular-places. As we’ve demonstrated, the map is more interesting when you start with somewhere you know. Does the dominant supermarket look right, and where does Starbucks become Dunkin'?
What this data can and cannot tell us
Coverage follows the apps, not the country. Our observations come from apps feeding IPinfo's measurement network, not from a sample of the US population. Tourism-heavy states are over-represented: Nevada shows almost four times as many observed devices per resident as Mississippi. So the state-level figures here are shares within a state, never comparisons between them.
The second limit is the amount of data itself. The picture becomes less consistent at the individual venue level. Most matched venues account for only a handful of observed devices, so the top venue in a state can change from one export to the next. Patterns at the category and brand level are much more stable, which is why this analysis focuses on those broader comparisons.
Brand coverage is uneven. It is strong for large chains and thinner elsewhere, and a venue with no brand attached is counted in its category but not under any brand.
The counts are cumulative. A device counts once per venue from the first time we saw it there, going back to April 2023, so a venue that closed last year can still appear.
None of our analysis is finished. We’re regularly evolving how we define our growing datasets, and corrections are part of that. If a place you know looks wrong, tell us at ipinfo.io/support.
Share this article


About the author

João Tomé is an Internet Data Research Editor at IPinfo, finding trends and stories about how the Internet works and changes. He has a background in journalism, data storytelling, and podcasting, including five years at Cloudflare.