
Get Unlimited Access to IPinfo Lite
Start using accurate IP data for cybersecurity, compliance, and personalization—no limits, no cost.
Sign up for freeEarlier this year we introduced our residential proxy detection data, which gives users clear signals on whether an IP is associated with a residential proxy provider.
Residential proxies are a type of IP anonymization that route traffic through real residential IPs, making online activity appear legitimate. Standard IP data can’t reliably identify this behavior — specialized detection methods are needed to distinguish genuine users from proxy-based activity.
And this type of IP anonymization is growing more popular for that very reason, fueling all types of online fraud.
That’s why we continue to improve how we identify and monitor these proxies — just in the past month we’ve grown the number of residential proxies in our 30-day database from 20 to 25 million IP addresses. We don’t want to risk a residential proxy IP slipping through the cracks, which could result in anything from web scraping to ad click fraud.
Looking at the last 30 days of residential proxy data, I’ve gained new insights into how, and where, these residential proxies operate.
One IP, Many Providers
A staggering 45% of IP addresses flagged as residential proxies appear in multiple provider pools. Some IPs show up an astounding amount of times, like 198.50.156.199 showing up in 75 different providers!
- What this tells us:
- Providers often resell from the same upstream sources.
- “Unique” IPs might not be so unique after all.
- Some “competitors” may be white-labeling the same inventory.
Why it matters: Risk engines treating IPs as provider-specific are missing the bigger picture.
Where the Proxies Really Are
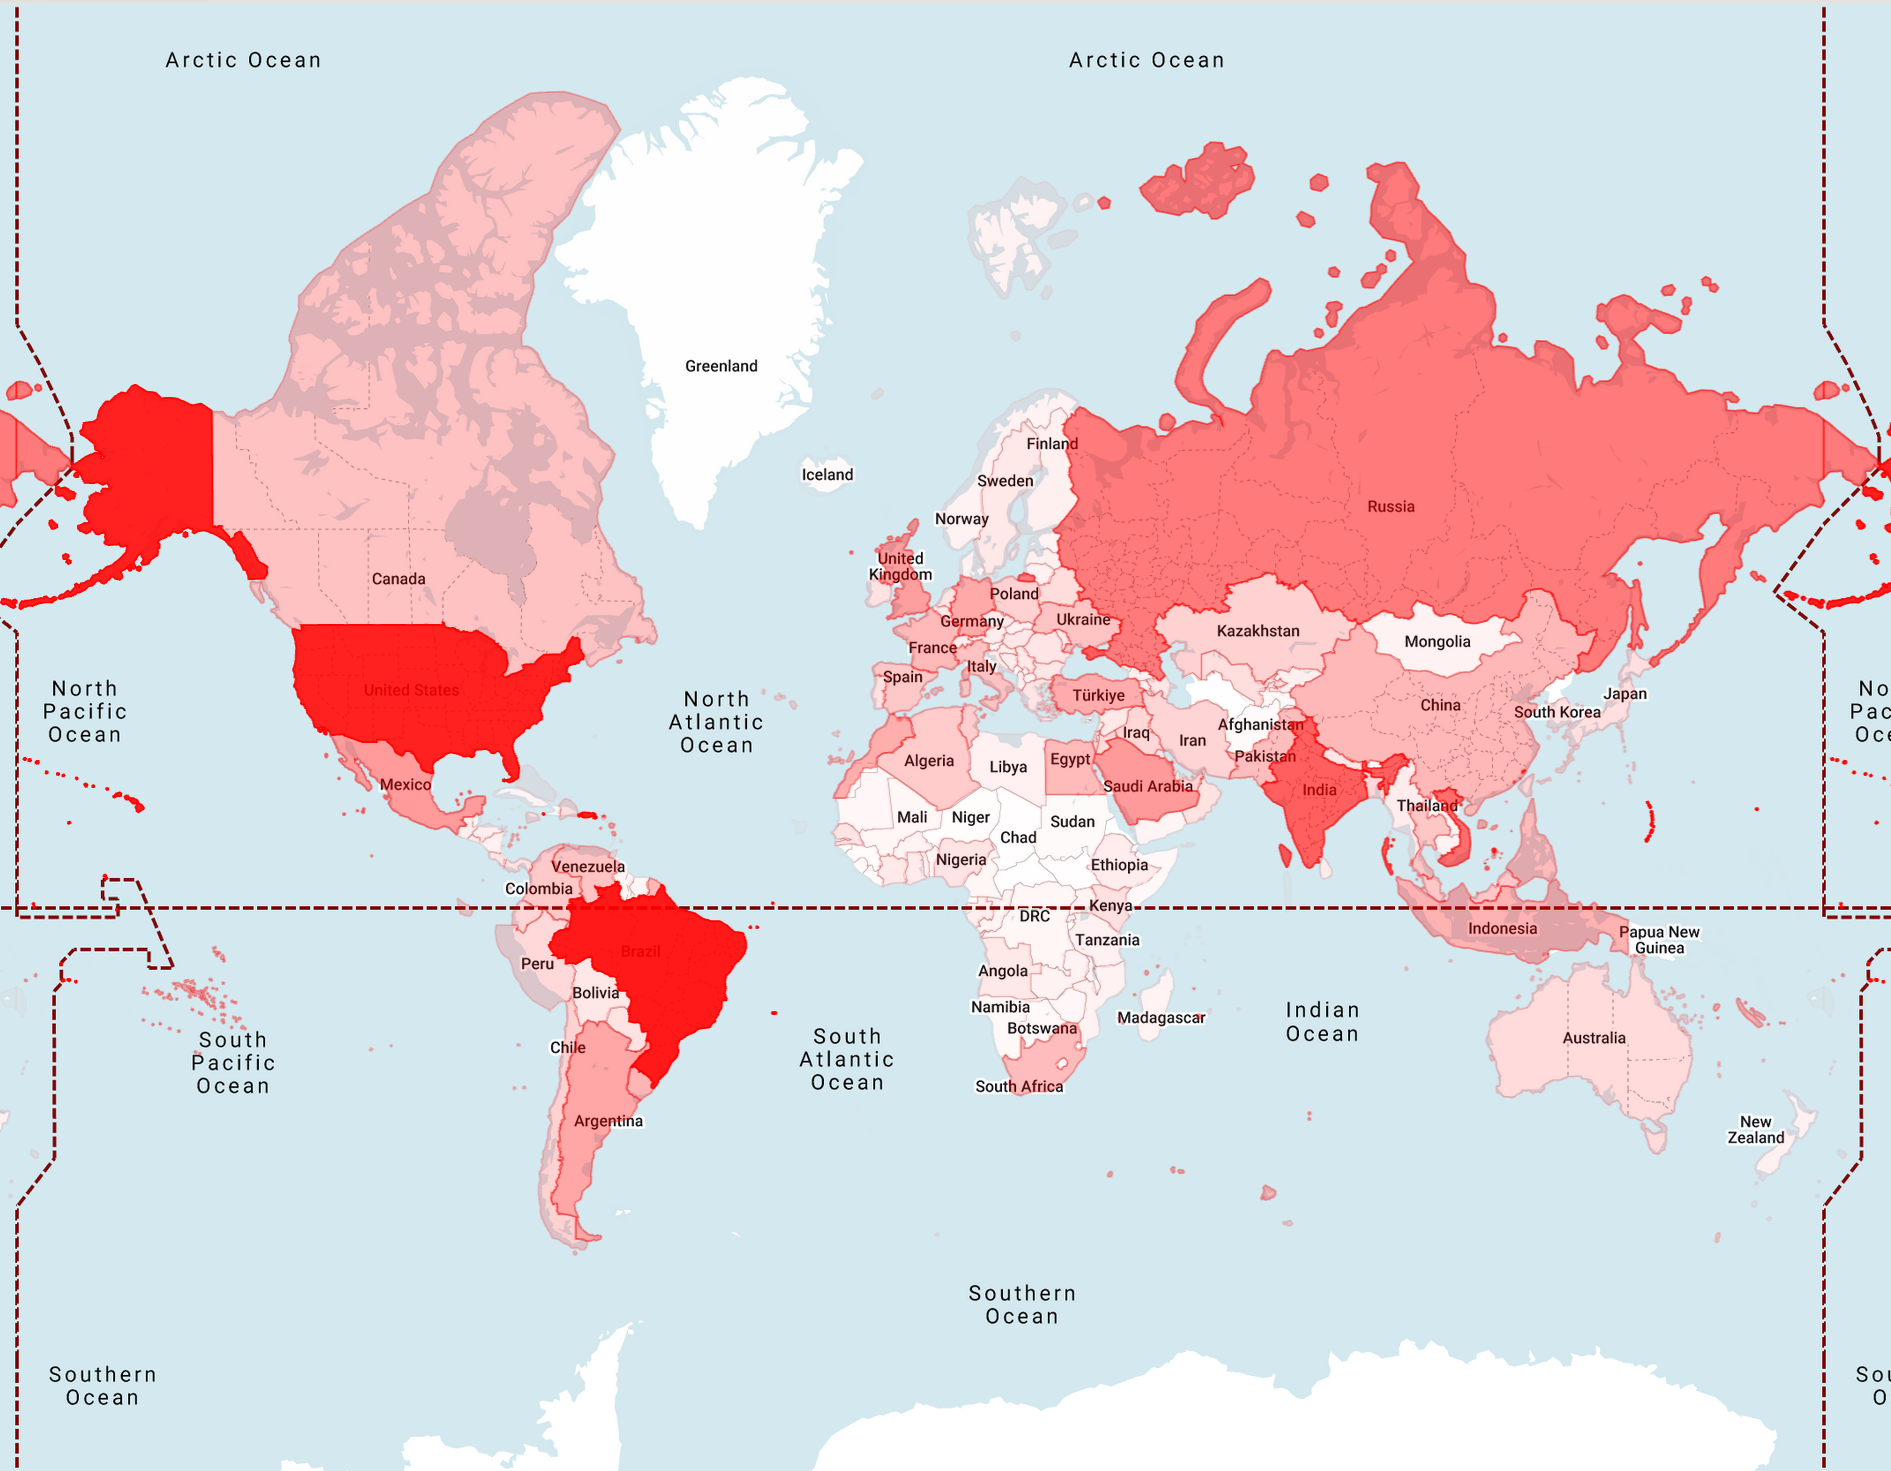
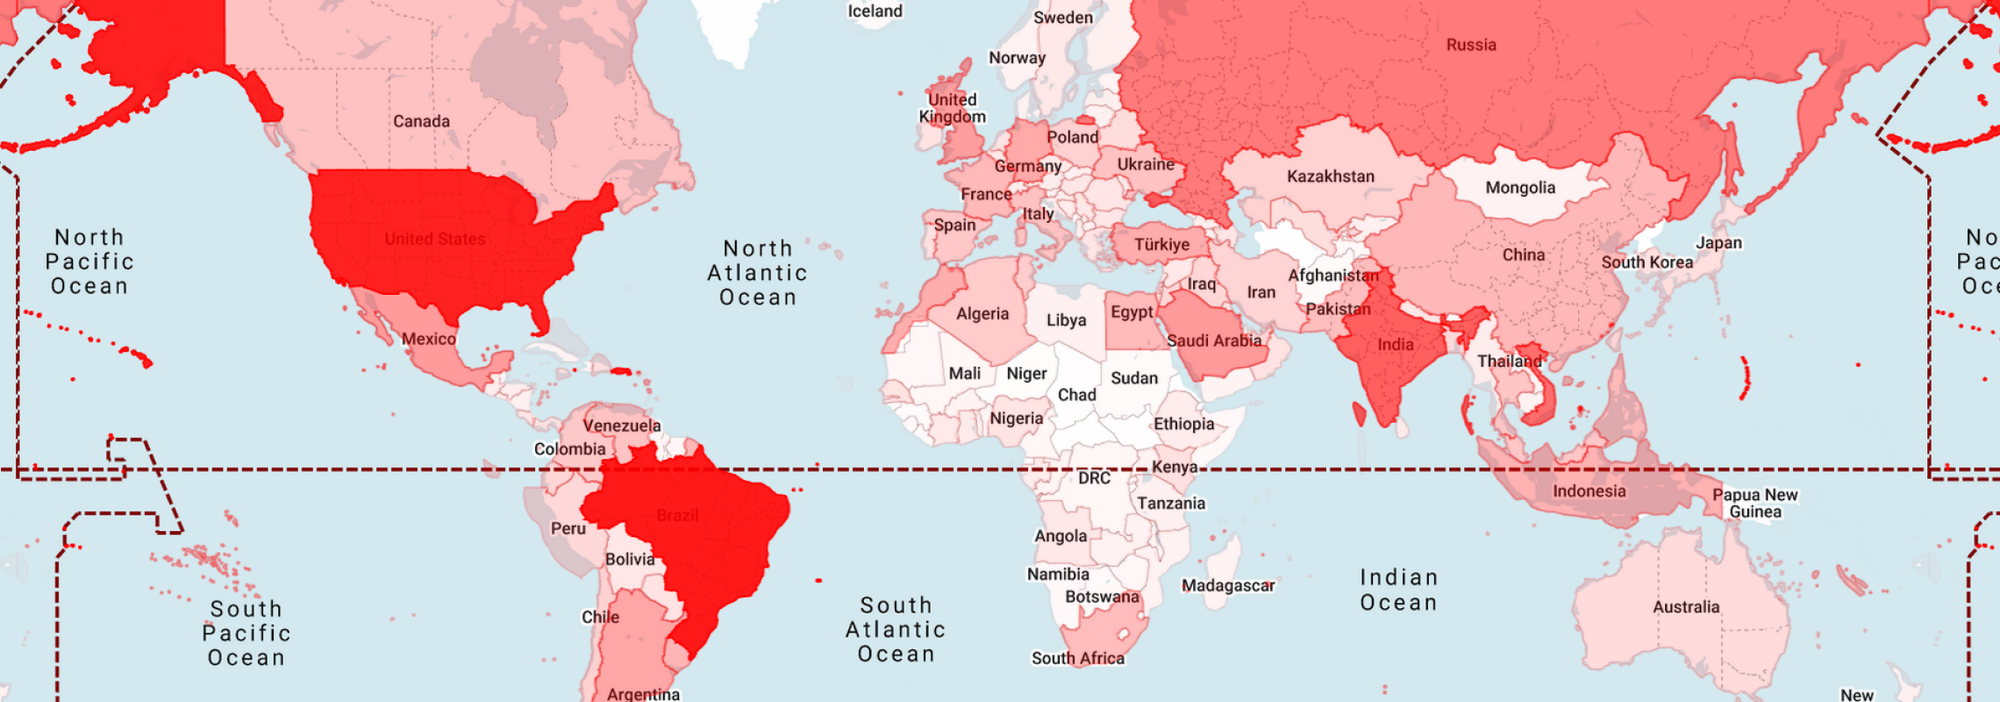
Residential proxy usage is heavily concentrated in just a handful of countries. While IPs appear across thousands of networks globally, most of the activity is driven by a small group of high-volume markets — countries where large populations, strong last-mile connectivity, and economic incentives for bandwidth-sharing apps come together.
The top five countries alone — Brazil, the United States, India, Vietnam, and Russia — account for over 46% of all residential proxy IPs observed in the past 30 days. Brazil leads the list with 3.66 million IPs, followed closely by the United States (3.44 million) and India (1.77 million). Vietnam and Russia follow with 1.46 million and 1.22 million, respectively.
*Based on ~26.3 M unique IPv4+IPv6 residential-proxy IPs observed in the last 30 days.
What these countries have in common isn’t just population size. They also have widespread mobile and broadband coverage, and a meaningful portion of users willing to monetize unused bandwidth. In lower- to middle-income markets like Brazil, India, Vietnam, and Russia, even small payouts from apps like Honeygain, or PacketStream are enough to drive adoption. In the United States, the appeal often lies in unlimited home internet plans.
Residential proxy supply appears to follow factors like:
- Broadband and mobile penetration (especially 4G+ and fiber)
- Population size
- Adoption of “get-paid-for-bandwidth” apps
Add an Essential Layer of Security
Identify proxy-driven traffic with IPinfo’s residential proxy detection and improve your risk management capabilities.
The ISPs Powering the Proxy Economy
While residential proxy IPs span tens of thousands of networks, most of the traffic is concentrated within a surprisingly small group of providers.
Over the last 30 days, we observed residential proxy activity in more than 33,000 unique ASNs (Autonomous System Numbers) which represents roughly a quarter of all allocated ASNs worldwide. But despite this wide reach, just 10 ISPs account for 20% of all residential proxy IPs. This means a handful of consumer internet providers are unintentionally responsible for powering a significant chunk of the global proxy supply.
And in some cases, the depth of this usage is staggering.
We also looked at what share of each ISP’s total IP address space was being used as a residential proxy. While most providers fall within a 2–5% range, some stand out dramatically. In some networks, nearly one in five IPs is part of a proxy pool, often without the ISP’s knowledge or the user’s full understanding. Others, by contrast, show very limited proxy activity. Here's what we found:
vs.
But this isn’t a story about these ISPs selling access directly. In almost all cases, this usage is unintentional — driven by end users who install bandwidth-sharing apps or browser extensions that monetize their connections. Some of these installs are voluntary; others may come bundled or misrepresented. And in some cases, malware may be involved.
This raises important questions about transparency, privacy, and consent. Are users truly aware their IP address is being rented out? Are ISPs equipped to detect or manage this kind of usage? And what happens when a major network becomes a hotspot for abuse because 20% of its subscribers have unwittingly joined a proxy pool?
IPv6 Is Still a Rarity
Within the last 30 days, we have seen roughly 21.7M v4 IPs (88%) vs. 2.9M (12%) IPv6 IPs. So IPv6 is in fact still a lot less common than v4 for residential proxies even though Google’s public stats show that almost half of global end-user traffic (≈ 48 %) now reaches Google over IPv6.
Why does proxy adoption lag? The most plausible factors could be:
- Customer demand remains IPv4-first. Many scraping, ad-verification, and sneaker-bot targets still whitelist IPv4 only.
- Rotation economics differ. Home routers typically expose just one, or a handful, of IPv6 addresses, so providers can’t cycle through “fresh” v6 exits the way they shuffle IPv4 /24s.
- Tooling & risk engines treat IPv6 as atypical. Some anti-fraud stacks still flag v6 traffic more aggressively, pushing vendors to stick with IPv4 where success rates are predictable.
For defenders an IPv6 address flagged as residential proxy is rare enough to merit extra scrutiny; blanket-blocking v6, however, risks high false-positive costs for minimal gain.
Churn Is the Norm
Roughly 2% of residential-proxy IPs drop out of our dataset each day over a 30-day window — meaning we saw them at least once and then never again for the next 30 days. At the same time the pool is constantly replenished: about 10% of all addresses we track have seen activity in the past 24 hours, and nearly 30% have shown up within the last five days. The result is a network that is in constant rotation, making it feel highly dynamic to anyone relying on, or trying to block, these proxies.
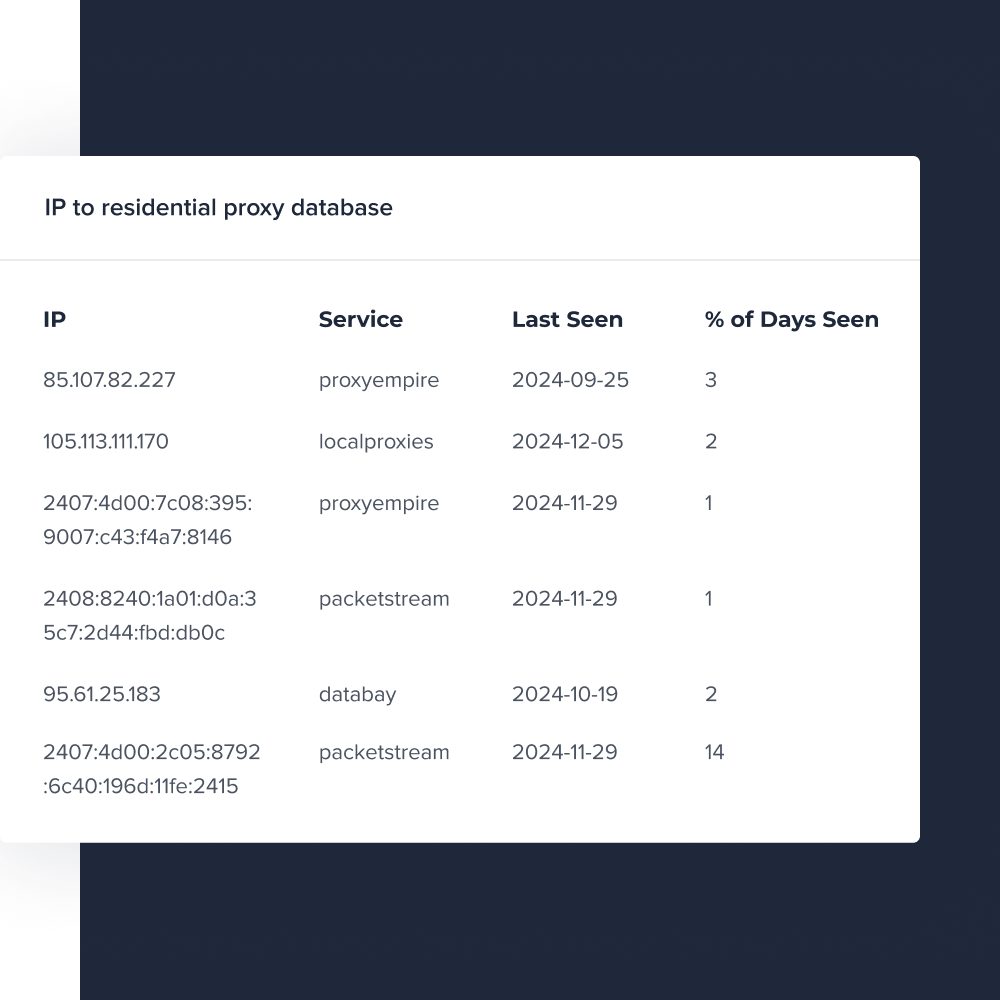
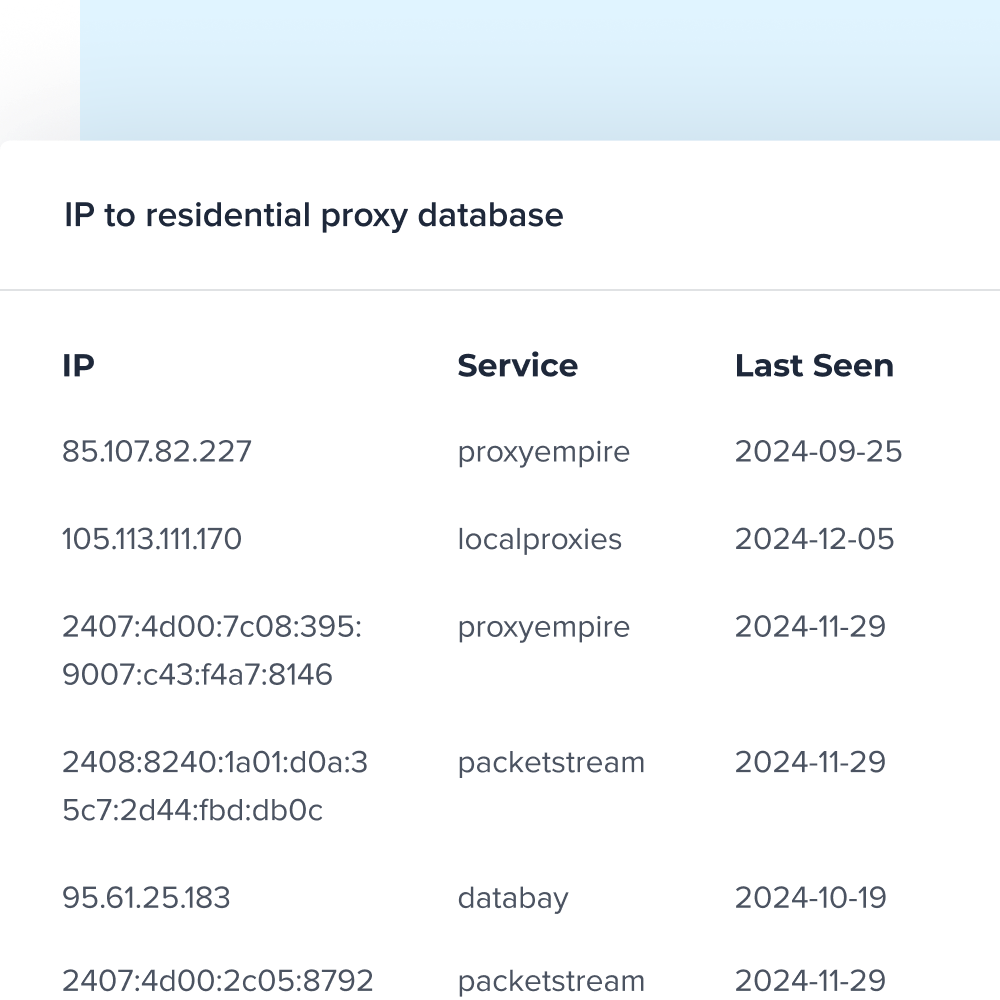
IPinfo’s Residential Proxy Detection data exposes two timing signals that make those churn numbers actionable:
- last_seen – the most recent date the IP was observed as a residential proxy.Use it to age out block-list entries and to spot “hot” IPs that are active right now.
- percent_days_seen – how often the IP was active over the look-back window (7 days in the API, 30/90 days in the database).High percentages flag sticky exit nodes worth a higher risk score; low percentages point to aggressively rotated addresses that behave more like one-time burners.
Together, these fields help security and fraud teams:
- Refresh block lists in near real-time instead of relying on static, quickly-stale denyfiles.
- Weight risk dynamically — a brand-new IP with a recent last_seen and high percent_days_seen is far more suspect than an address last active months ago.
- Cut false positives by distinguishing long-lived home connections occasionally rented out from short-lived, high-rotation proxy exits.
Identify Residential Proxy IPs With IPinfo
Residential-proxy traffic isn’t a shadowy blur once you look at the data: the same IPs cycle rapidly rather than vanishing, most of the supply comes from a handful of countries and ISPs, and IPv4 still dwarfs IPv6. Recognizing those patterns lets security teams refresh block-lists intelligently instead of blocking in the dark.
IPinfo’s Residential Proxy Detection, delivered as an API or downloadable database, flags proxy IPs and includes freshness-timestamp and percentage days seen so you can score risk, rotate rules automatically, or enrich historical logs with confidence.
In short, residential proxies are measurable — and manageable — when you have the right data. If you’d like to see how our detection feed can sharpen your defenses or analytics pipeline, we’d be happy to share a trial key or sample dataset.
Detect Residential Proxies with Accurate IP Data
Add a critical layer of defense to your fraud prevention and security workflows.
Share this article
About the author

Daniel Quandt leads the solutions engineering team at IPinfo, where he helps customers get the most out of internet data. Before IPinfo, he worked in data science in the hospitality industry.